A Market Divided Against Itself
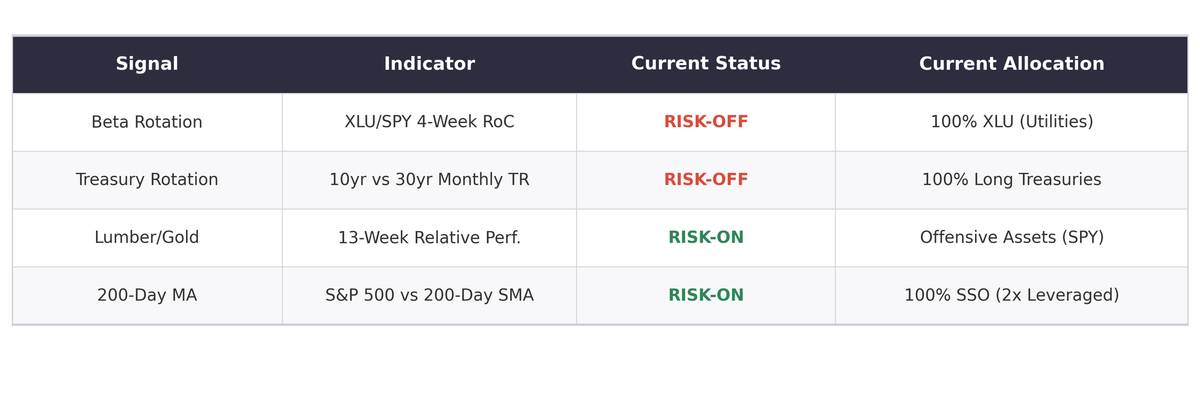
Signals are split evenly between offense and defense, pointing to a market at an inflection point.
Today’s Lead-Lag Report post is sponsored by TappAlpha

Income while staying fully invested in equities.
TappAlpha S&P 500 Growth & Daily Income ETF (TSPY).
TappAlpha Innovation 100 Growth & Daily Income ETF (TDAQ).
Investors have always had to choose: generate income or stay fully invested. TSPY and TDAQ do both—adding tax-efficient income potential to the S&P 500 and Nasdaq-100. A tax-efficient alternative to traditional income strategies. Growth + Income — with the TappAlpha Growth & Daily Income ETFs.
Investors should carefully consider the investment objectives, risks, charges and expenses of the ETFs identified on this site. This and other important information about the Fund are contained in the prospectus, which can be obtained by visiting tappalphafunds.com or by calling (844) 403-2888. The prospectus should be read carefully before investing.
ETFs are subject to additional risks that do not apply to conventional mutual funds, including the risks that the market price of an ETF’s shares may trade at a premium or discount to its net asset value, an active secondary trading market may not develop or be maintained, or trading may be halted by the exchange in which they trade, which may impact a Fund’s ability to sell its shares. Shares of any ETF are bought and sold at market price (not NAV) and are not individually redeemed from the Fund. Brokerage commissions will reduce returns.
The Fund invests in options contracts that are based on the value of the Index, including SPX and XSP options for TSPY and XND and NQX options for TDAQ. This subjects the Fund to certain of the same risks as if it owned shares of companies that comprised the Index, even though it does not own shares of companies in the Index. The Fund will have exposure to declines in the Index. The Fund is subject to potential losses if the Index loses value, which may not be offset by income received by the Fund. To the extent that the Fund invests in other ETFs or investment companies, the value of an investment in the Fund is based on the performance of the underlying funds in which the Fund invests and the allocation of its assets among those ETFs or investment companies. The Fund may incur high portfolio turnover to manage the Fund’s investment exposure. The Fund is classified as “non-diversified” under the 1940 Act.
As of the date of this prospectus, the Fund has no operating history and currently has fewer assets than larger funds. Like other new funds, large inflows and outflows may impact the Fund’s market exposure for limited periods of time. This impact may be positive or negative, depending on the direction of market movement during the period affected.
Due to the short time until their expiration, 0DTE options are more sensitive to sudden price movements and market volatility than options with more time until expiration. Because of this, the timing of trades utilizing 0DTE options becomes more critical. Even a slight delay in the execution of 0DTE trades can significantly impact the outcome of the trade. 0DTE options may also suffer from low liquidity, making it more difficult for the Fund to enter into its positions each morning at desired prices. The bid-ask spreads on 0DTE options can be wider than with traditional options, increasing the Fund’s transaction costs and negatively affecting its returns. These risks may negatively impact the performance of the fund.
Distributor: Foreside Fund Services, LLC
DISCLAIMER – PLEASE READ: This is sponsored advertising content for which Lead-Lag Publishing, LLC has been paid a fee. The information provided in the link is solely the creation of TappAlpha. Lead-Lag Publishing, LLC does not guarantee the accuracy or completeness of the information provided in the link or make any representation as to its quality. All statements and expressions provided in the link are the sole opinion of TappAlpha, and Lead-Lag Publishing, LLC expressly disclaims any responsibility for action taken in connection with the information provided in the link.
A Market Divided Against Itself
Signals are split evenly between offense and defense, pointing to a market at an inflection point.
Week Ending July 17, 2026
By Michael A. Gayed, CFA
Key Takeaways
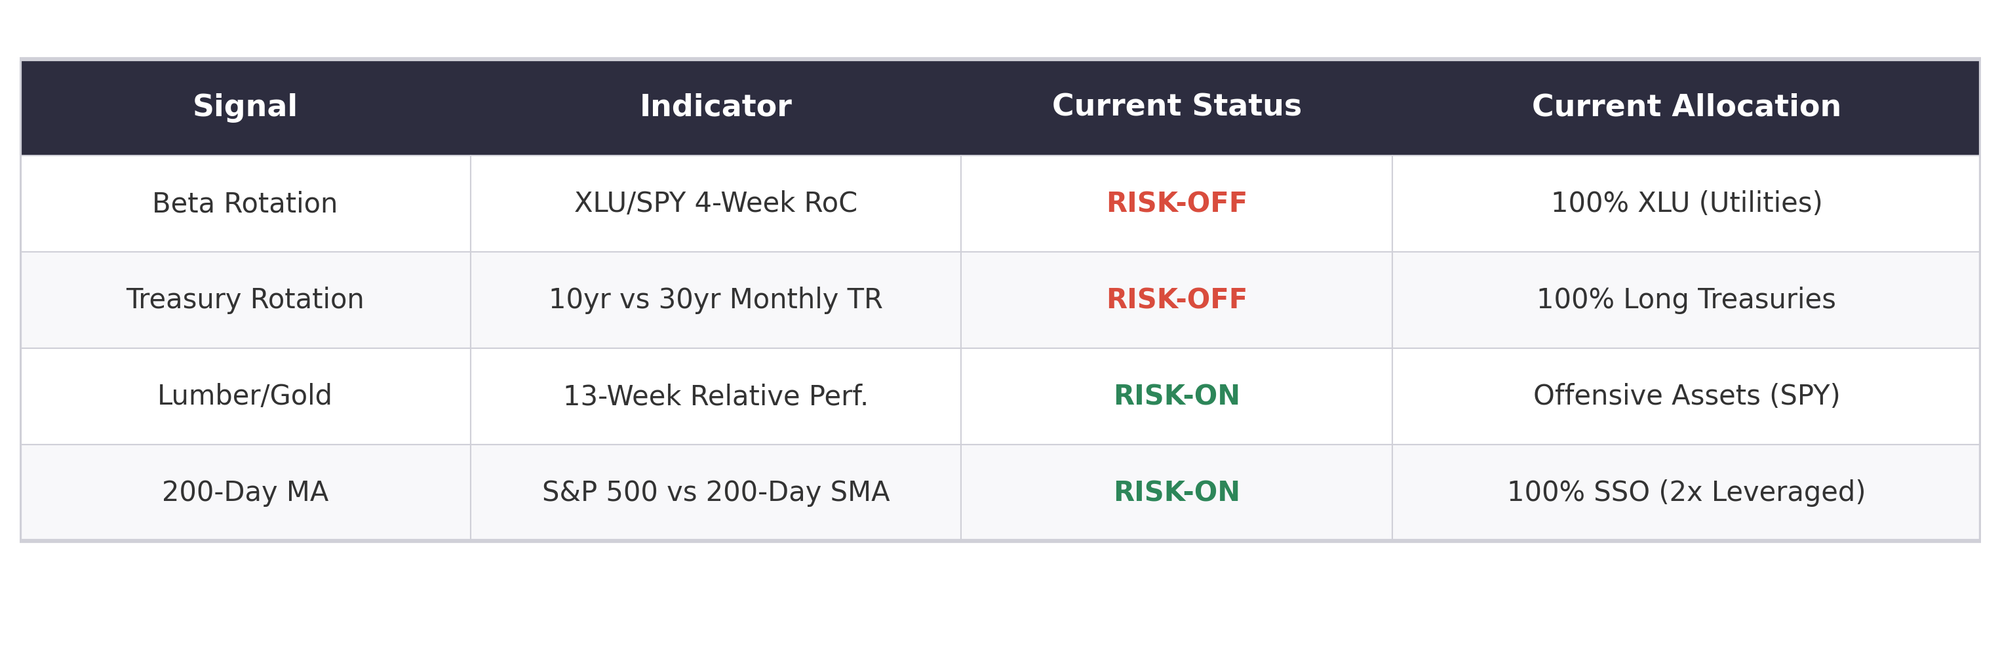
- Signal 1 (Beta Rotation) is RISK-OFF. The XLU/SPY 4-week rate of change stands at +1.38%. Utilities are outperforming the S&P 500 over the past four weeks, a defensive tilt. Allocation calls SPY.
- Signal 2 (Treasury Rotation) is RISK-OFF on the latest May month-end reading. TLT returned 0.16% versus IEF at −0.35%. Long-duration bonds outperformed intermediate. Allocation calls VLGSX/TLT.
- Signal 3 (Lumber/Gold) is RISK-ON on the latest 13-week relative-performance reading. Lumber's 13-week return of 9.20% exceeds gold's −16.85%. All seven Lumber/Gold sub-strategies point offensive.
- Signal 4 (200-Day MA) remains RISK-ON. The S&P 500 at 7,457.69 sits +6.7% above its 200-day SMA of 6,987.23. Allocation calls SSO (2x leveraged S&P 500).
Signal Summary
Composite: TILT RISK-ON (+15 on a −100/+100 conviction-weighted scale)
2-of-4 RISK-ON · 2-of-4 RISK-OFF
Inflection alert: the four signals are evenly split. Mixed readings historically precede sharper resolutions in either direction — watch the next two weeks for confirmation.
Market Commentary
The framework reads 2-2 Risk-On this week. Two of four signals favor risk-on positioning and two signals flag defense. The S&P 500 closed at 7,457.69 on July 17. The index continues to sit above its 200-day moving average, keeping the trend structurally intact, but the internal composition has shifted defensive on two of the four rotational reads.
The Beta Rotation signal is RISK-OFF with the XLU/SPY 4-week Rate of Change at +1.38%. Utilities are outperforming the broad market over the trailing four weeks. This is a classic defensive tell inside the equity complex. It doesn't mean equities must sell off from here — it means the leadership under the surface has shifted toward the lowest-beta sector.
The Treasury Rotation signal is RISK-OFF on the latest May month-end reading. TLT returned 0.16% in May versus IEF at −0.35%. The long bond outperformed the intermediate bond. That's a duration bid, historically associated with slowing growth or falling forward inflation expectations. The signal now calls for a full weight in long-duration Treasuries.
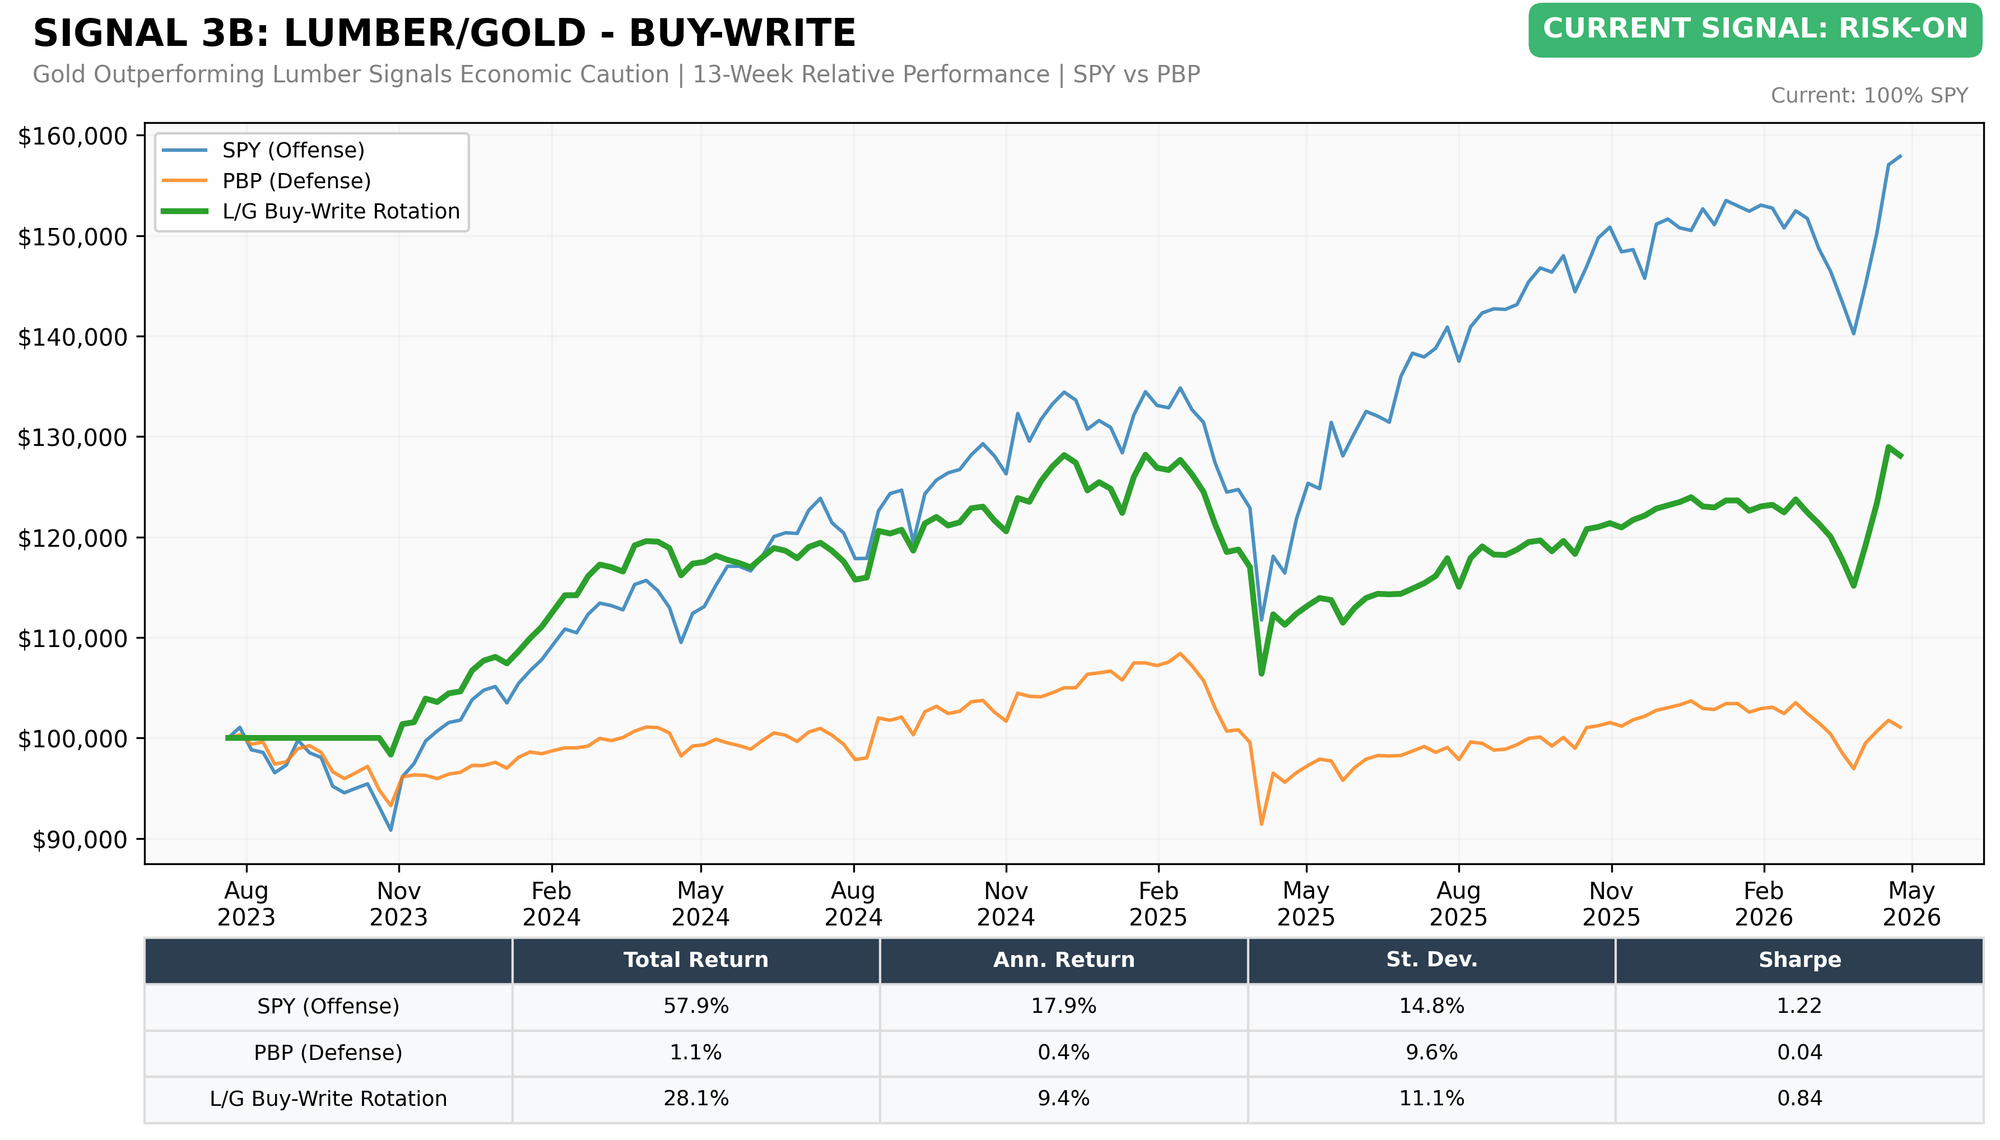
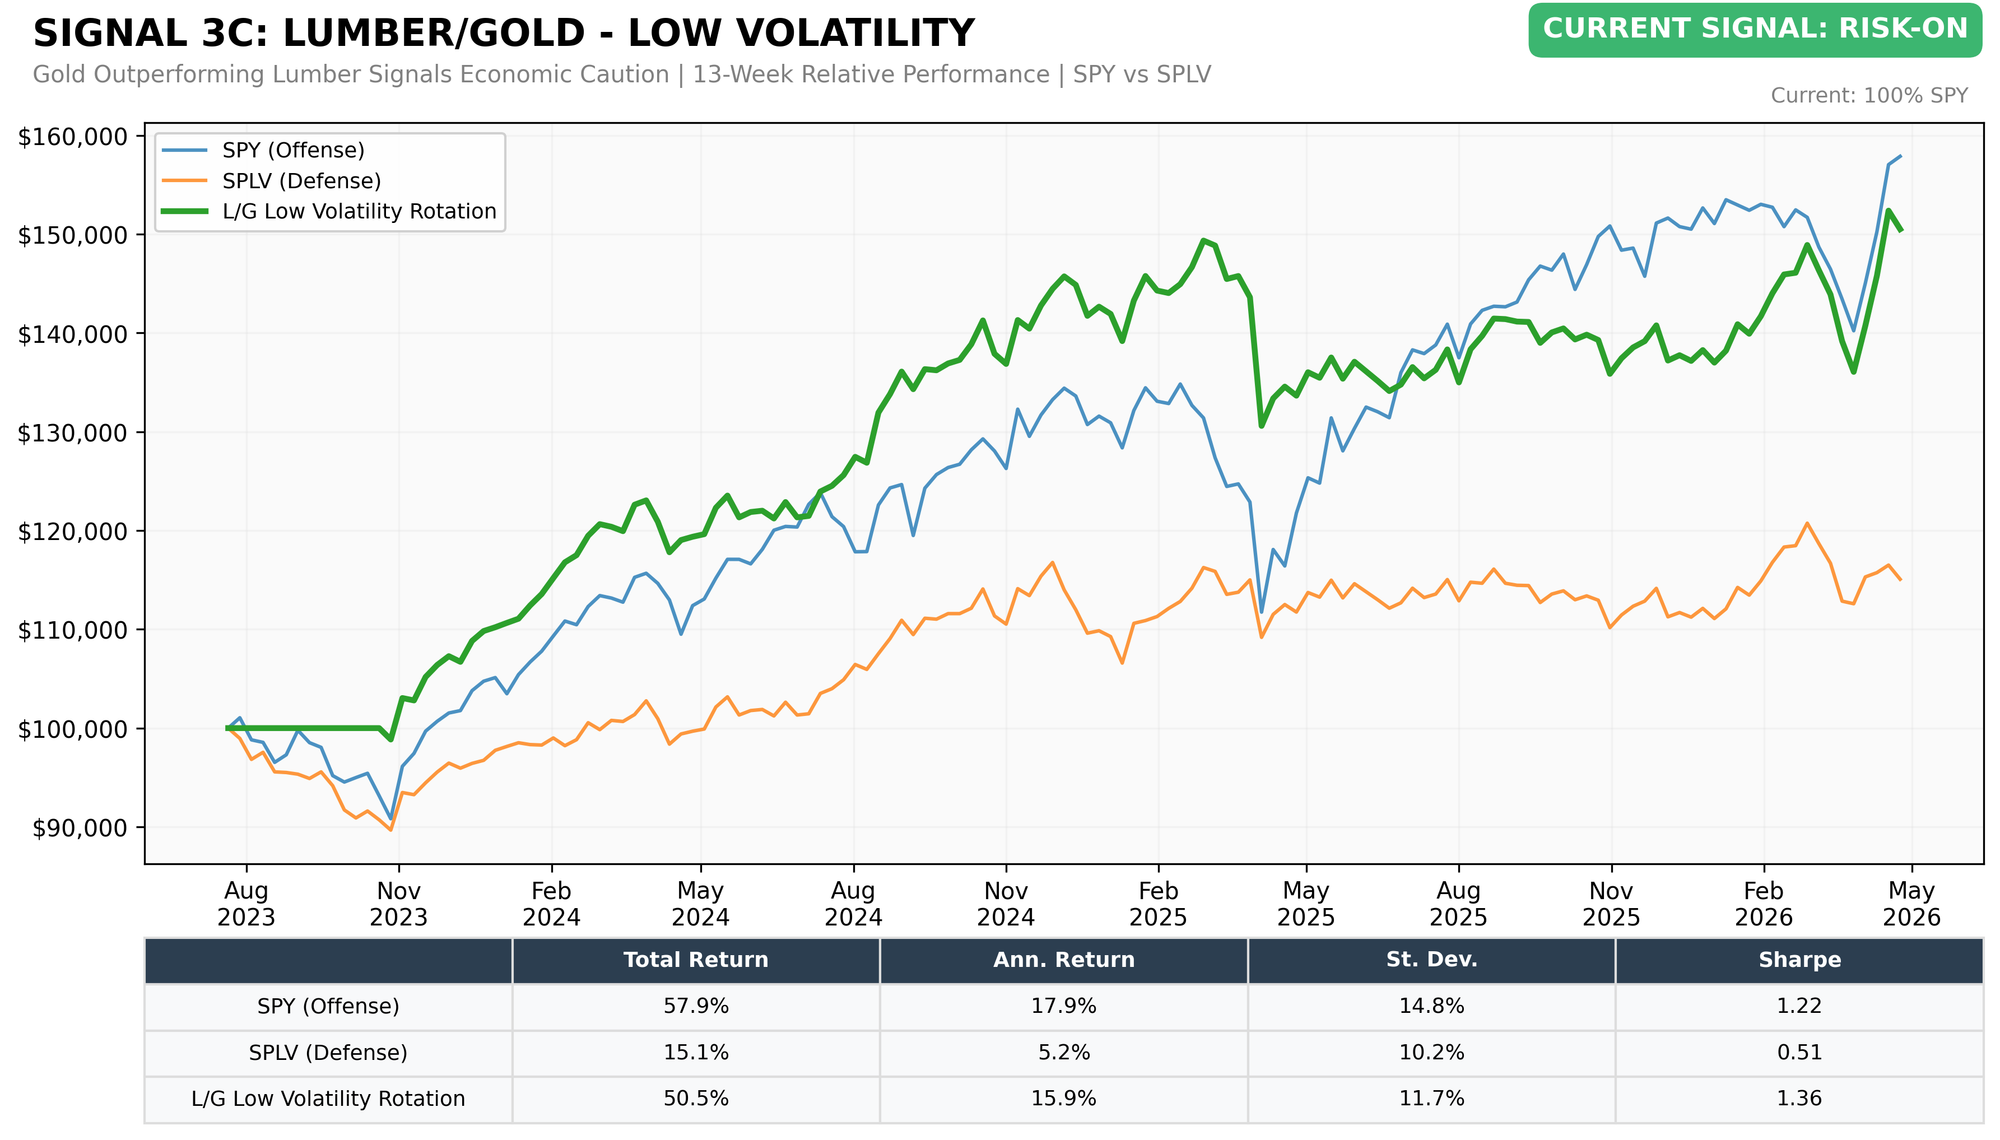
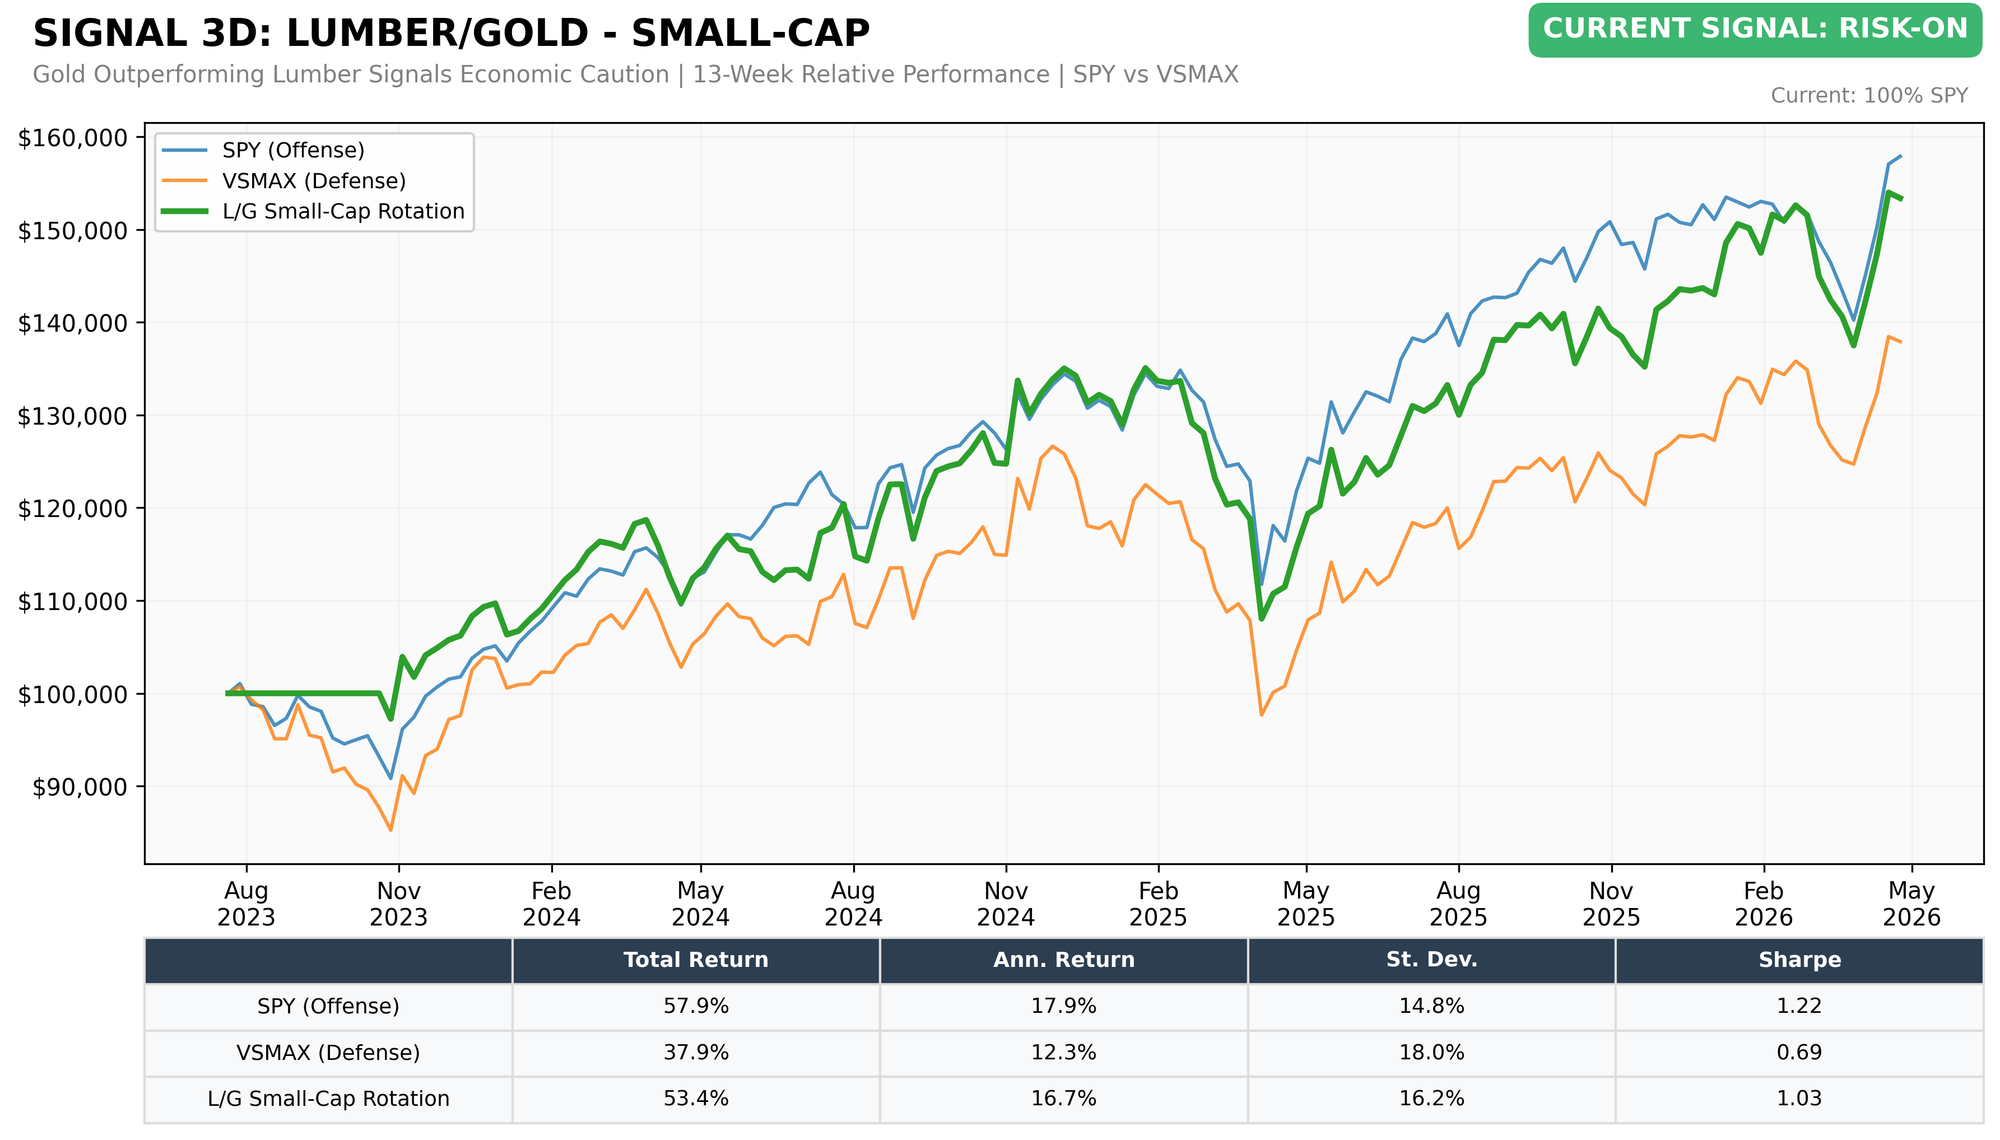
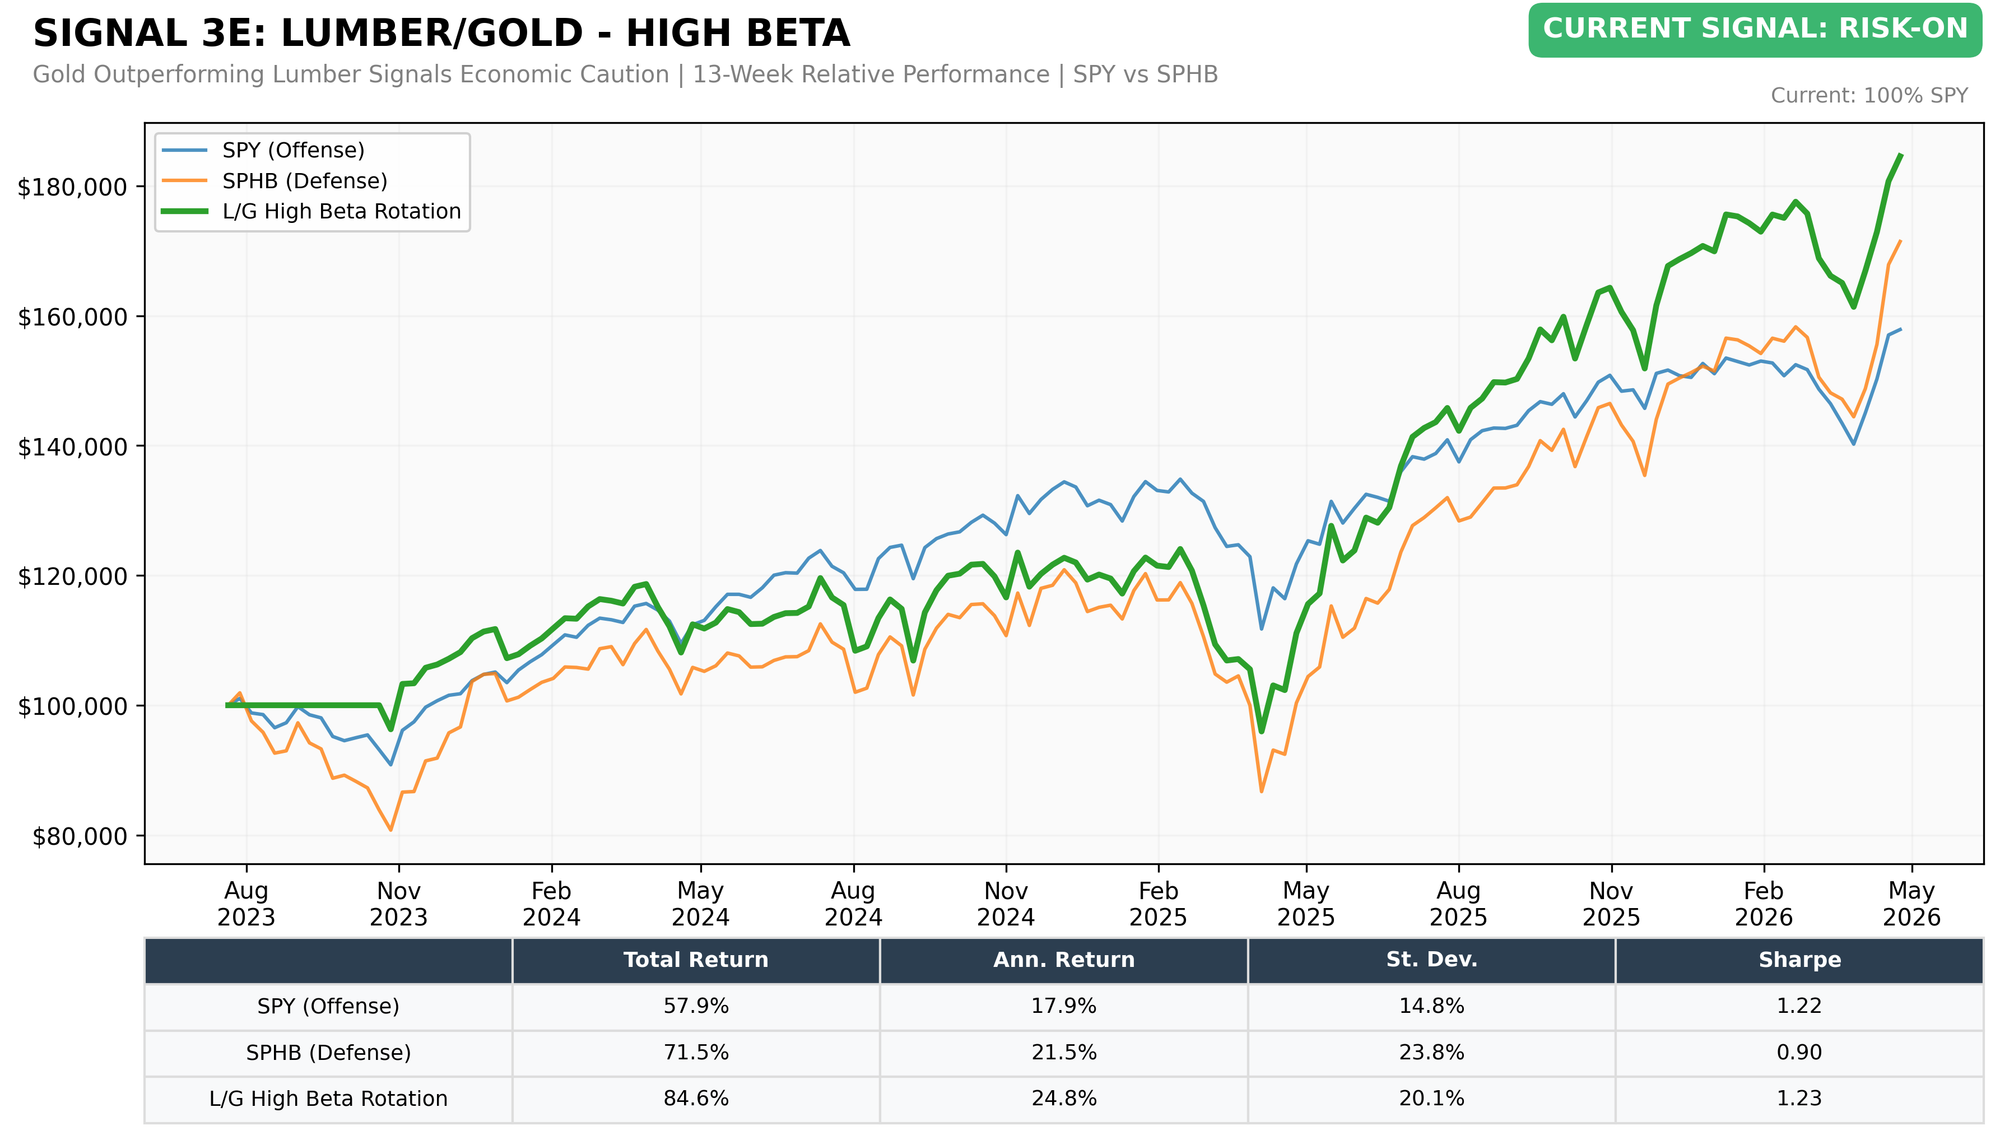
The Lumber/Gold signal is RISK-ON on the latest 13-week reading. Lumber's 13-week return of 9.20% exceeds gold's −16.85%. That's a wide spread favoring offense. All seven Lumber/Gold sub-strategies have rotated offensive. Historically, wide positive spreads in this ratio have preceded periods of stronger risk-asset returns.
The 200-Day MA signal at +6.7% cushion above the moving average leaves plenty of headroom before flipping defensive. The trend is up, the cushion is comfortable, and the signal calls for the 2x leveraged S&P 500 vehicle (SSO).
The 2-2 reading sits evenly split, an inflection-point posture where the framework offers neither full offense nor full defense. Mixed readings historically precede sharper resolutions in either direction — watch the next two weeks for confirmation.
Signal 1: Beta Rotation
Based on: “An Intermarket Approach to Beta Rotation: The Strategy, Signal, and Power of Utilities (SSRN 2417974)”
Target Investor: Self-directed investors who want to capture relative strength between equity market segments. This signal uses the 4-week rate of change of the XLU/SPY ratio to switch between defensive and offensive equity exposure.
Current Indicator: RISK-OFF
Conviction: 57/100 · Regime age: 3 weeks (21 days) · Whipsaw alert: 3 flips in last 12 readings
What would flip this signal: Signal flips RISK-ON when the XLU/SPY 4-week rate of change crosses zero (currently +1.38%). That requires the XLU/SPY ratio to fall to 0.05994 from today's 0.06077.
Prior RISK-OFF regimes: Jun 2026 (1d), Feb 2026–Apr 2026 (56d), Jan 2026 (1d).
XLU/SPY 4-Week Rate of Change: +1.38%
Current Allocation: 100% SPY (S&P 500)
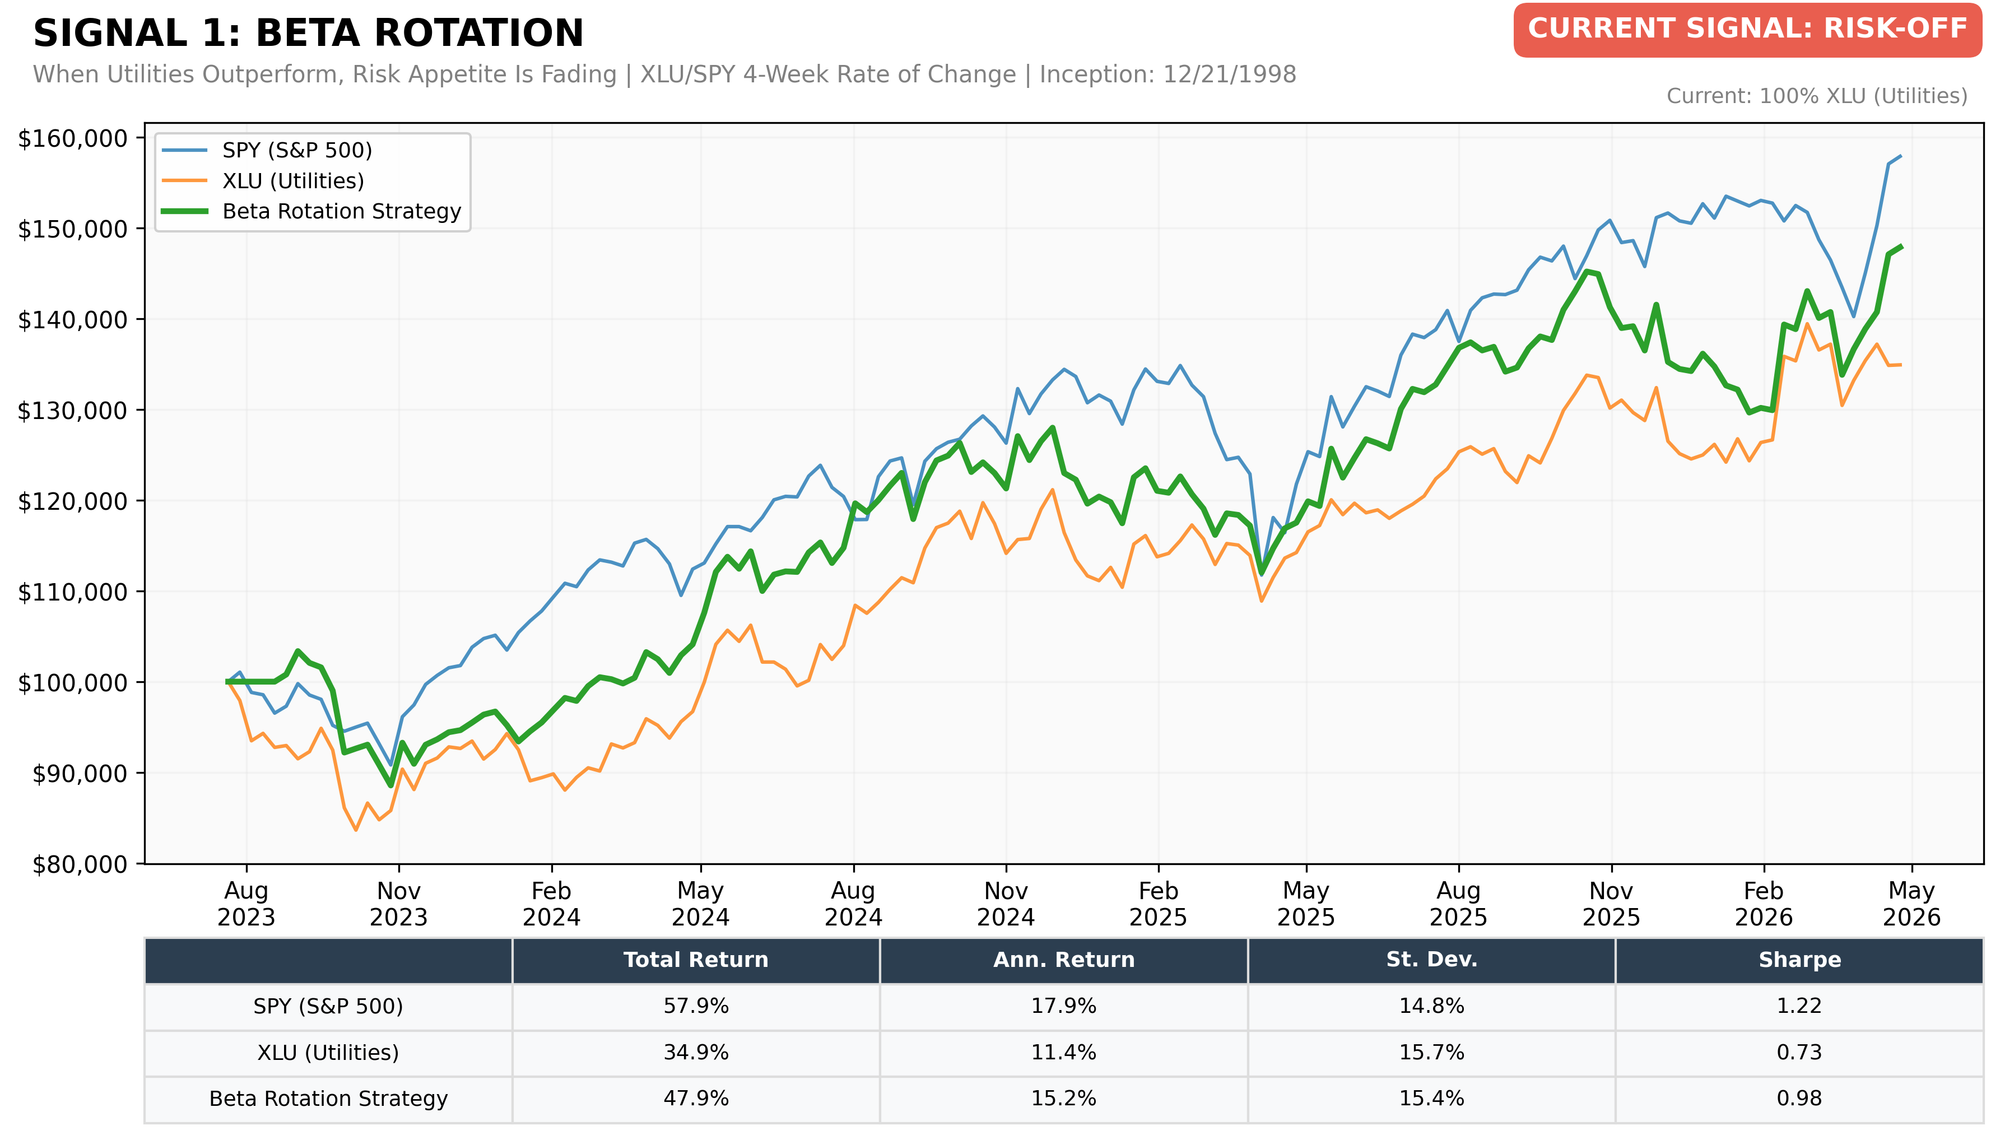
Reading the chart: XLU/SPY 4-week RoC currently +1.38%. Flip threshold: 0.00%. Distance to flip: 1.38 percentage points.
Signal 2: Tactical Risk Rotation
Based on: “A Quantitative Approach to Tactical Asset Allocation (SSRN 2431022)”
Target Investor: Conservative to moderate investors seeking a tactical overlay between equities and long-duration Treasuries. This signal compares the prior month's TLT (30-year Treasury) return to IEF (10-year Treasury) and rotates monthly.
Current Indicator: RISK-OFF
Conviction: 55/100 · Regime age: 1082+ days · Whipsaw alert: 6 flips in last 12 readings
What would flip this signal: Signal flips RISK-ON when next month's IEF return exceeds TLT. Current spread: TLT +0.16% vs IEF -0.35% (+0.51 pp).
Prior RISK-OFF regimes: May 2026–Jun 2026 (30d), Jan 2026–Feb 2026 (28d), Sep 2025–Oct 2025 (31d).
30-year Treasury (TLT) May Return: +0.16% • 10-year Treasury (IEF) May Return: −0.35%
Current Allocation: 100% Long-Duration Treasuries (VLGSX/TLT)
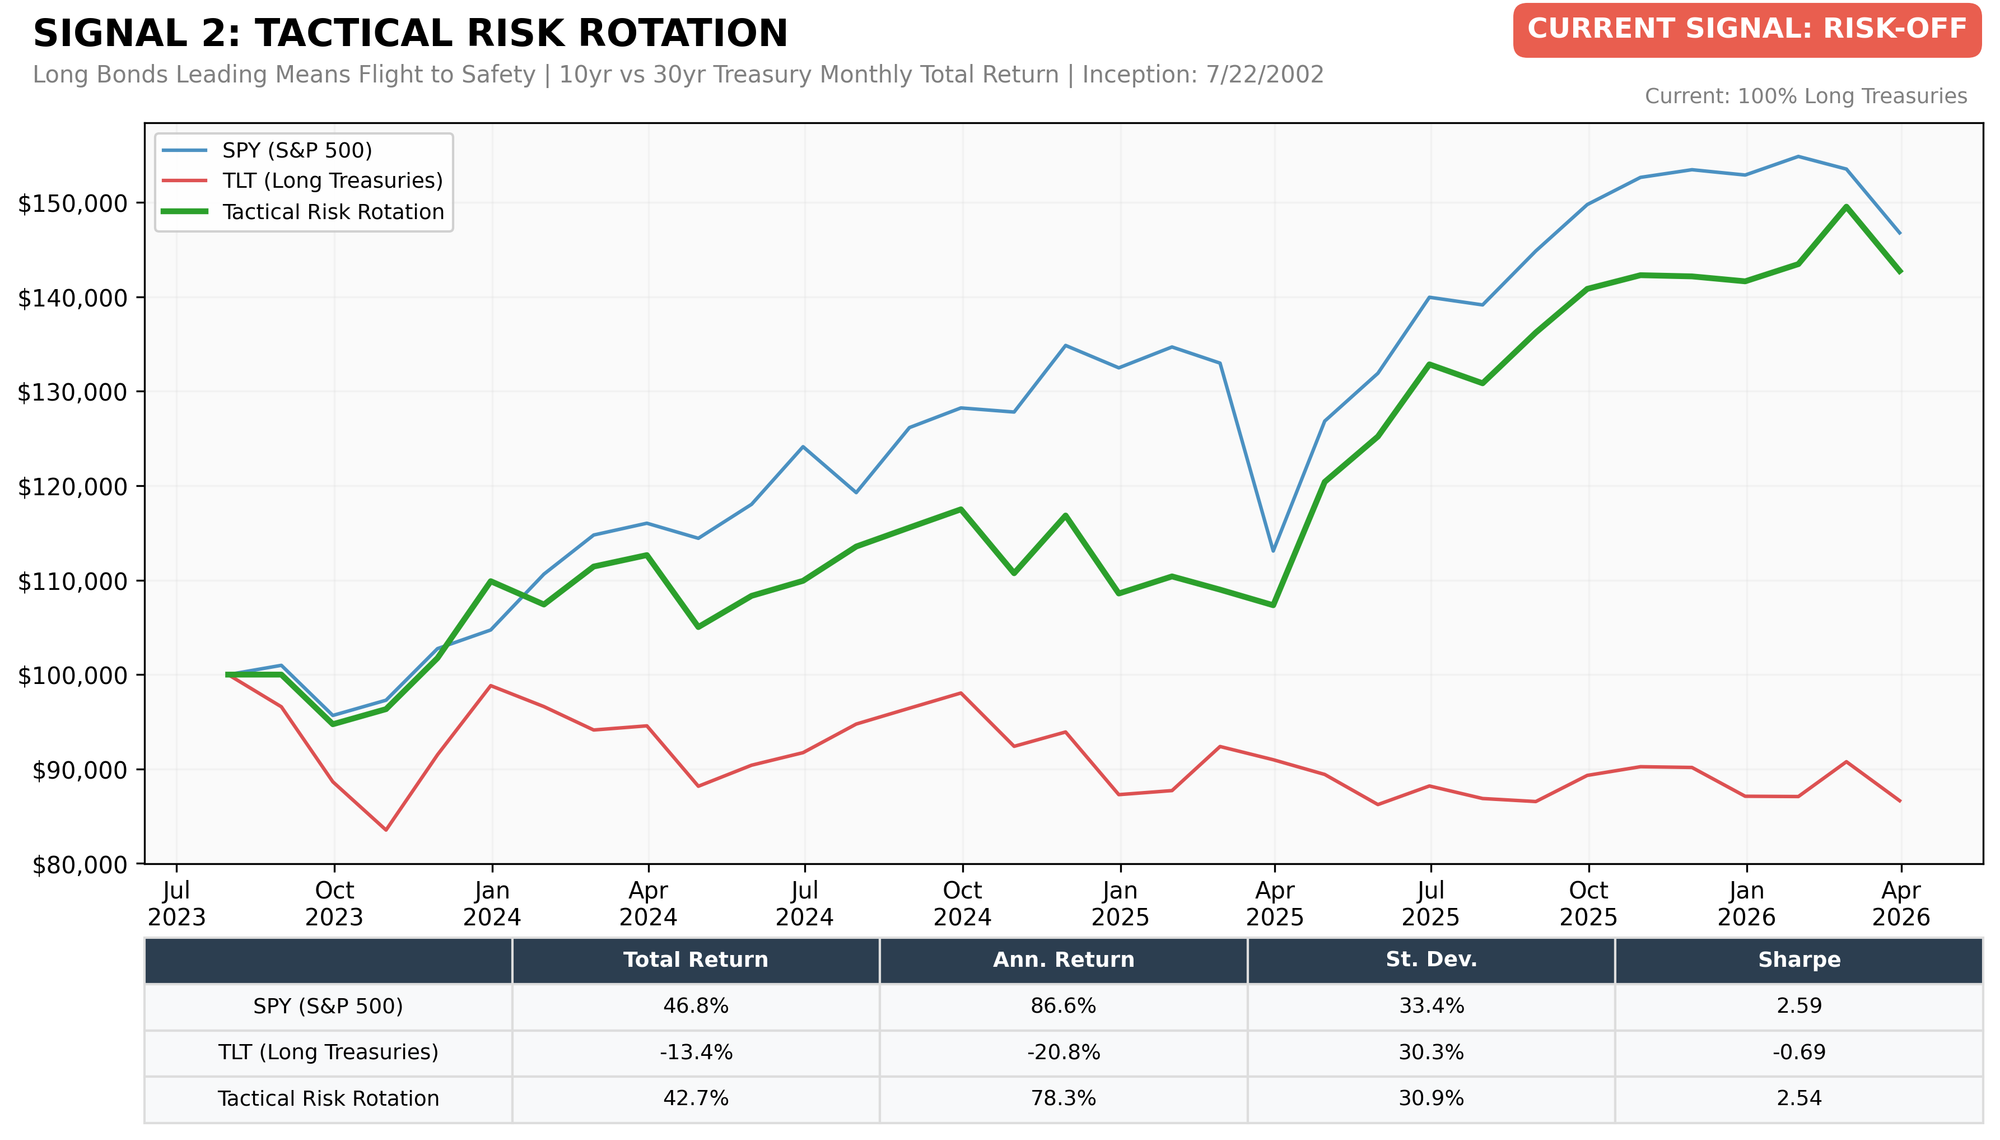
Reading the chart: TLT-minus-IEF May return spread +0.51 pp. Flip threshold: spread crosses 0%. Distance to flip: 0.51 percentage points.
Signal 3: Lumber/Gold Ratio
Based on: “Lumber: Worth Its Weight in Gold (SSRN 2604248)”
Target Investor: Active investors seeking to rotate between offensive and defensive exposures across multiple asset class pairings. This signal uses the 13-week relative performance of lumber vs. gold to switch between risk-on and risk-off across seven paired strategies.
Current Indicator: RISK-ON
Conviction: 96/100 · Regime age: ~2 months (84 days)
What would flip this signal: Signal flips RISK-OFF when gold overtakes lumber on a 13-week return basis. Current spread: lumber +9.2% vs gold -16.9% (+26.1 pp gap).
Prior RISK-ON regimes: Mar 2026–Apr 2026 (21d), Aug 2025 (1d), Jul 2025–Aug 2025 (28d).
Lumber 13-Week Return: +9.20% • Gold 13-Week Return: −16.85%
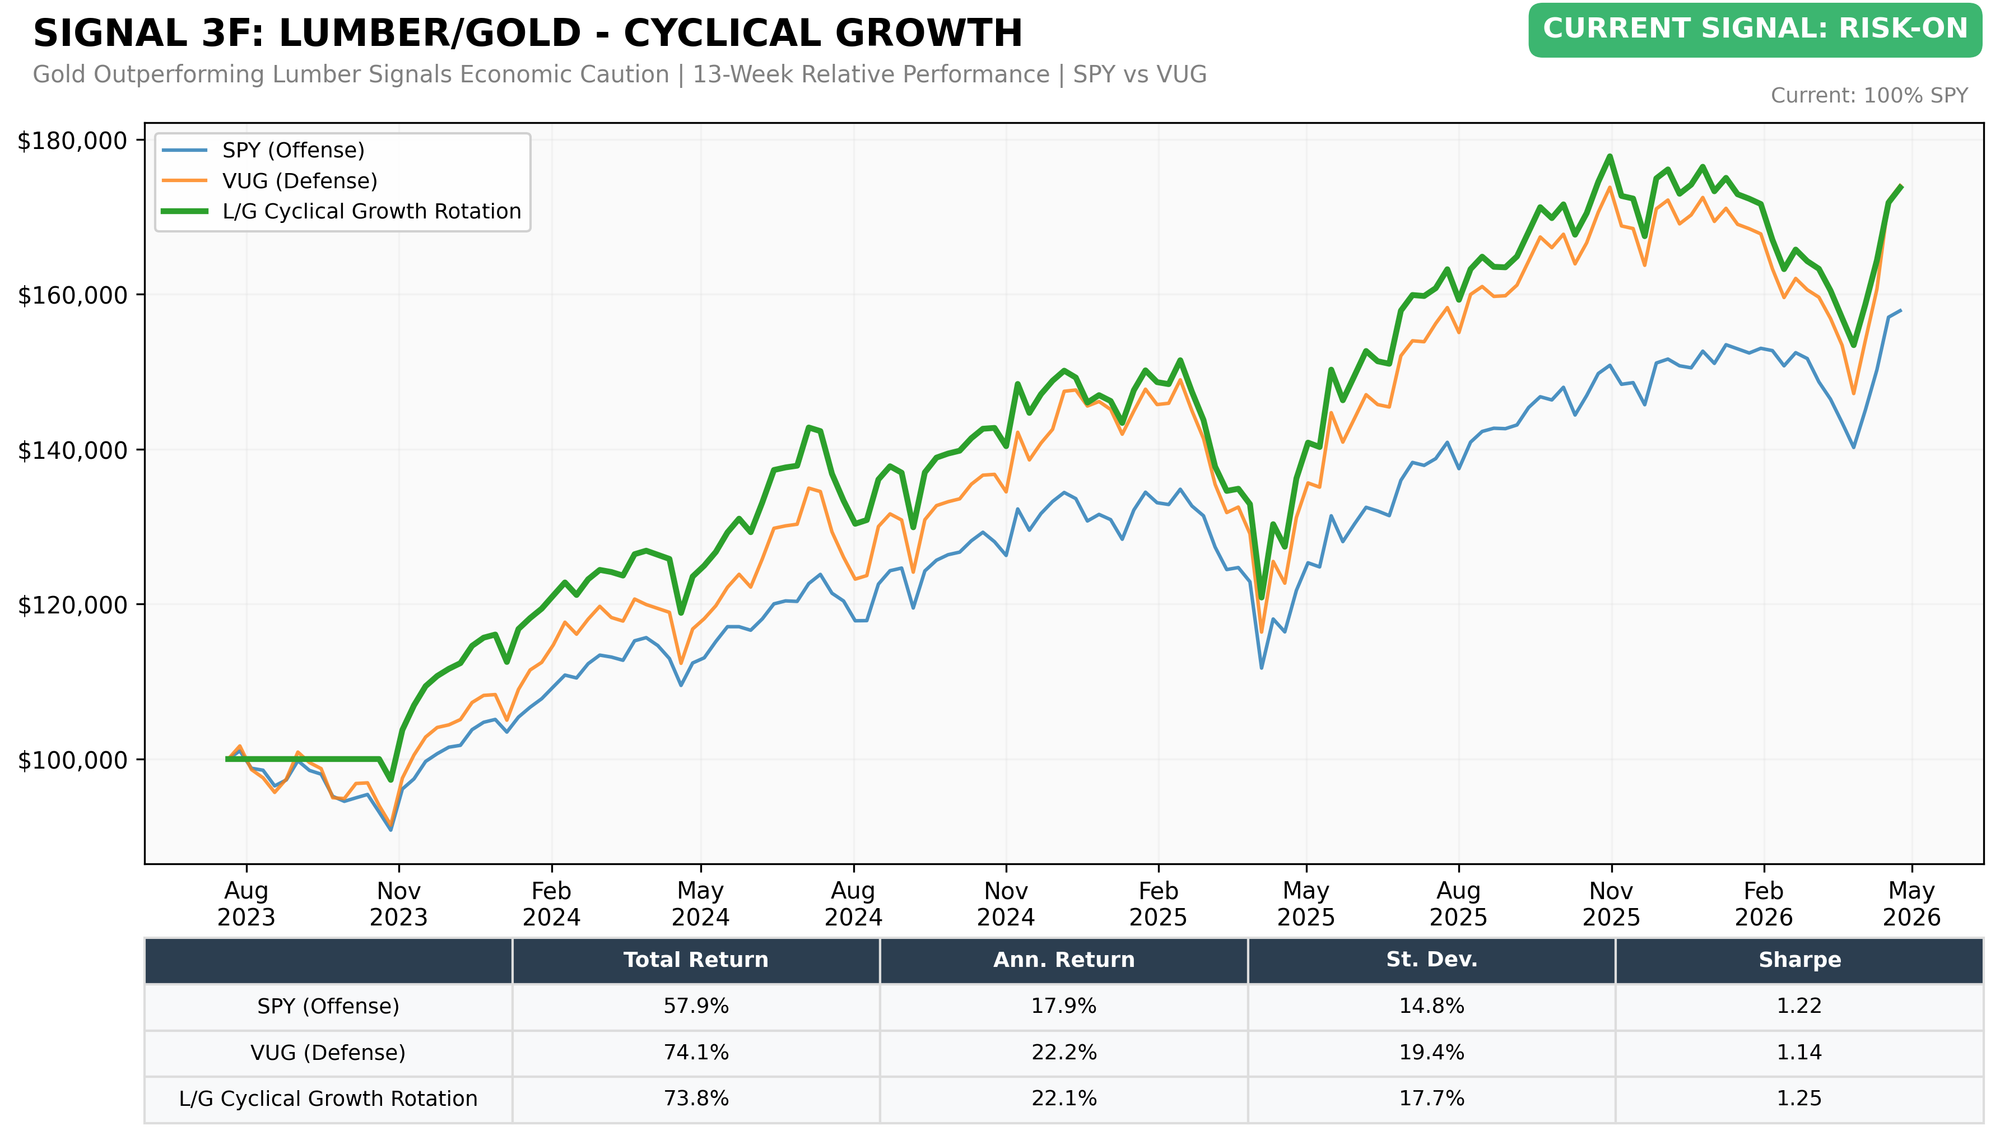
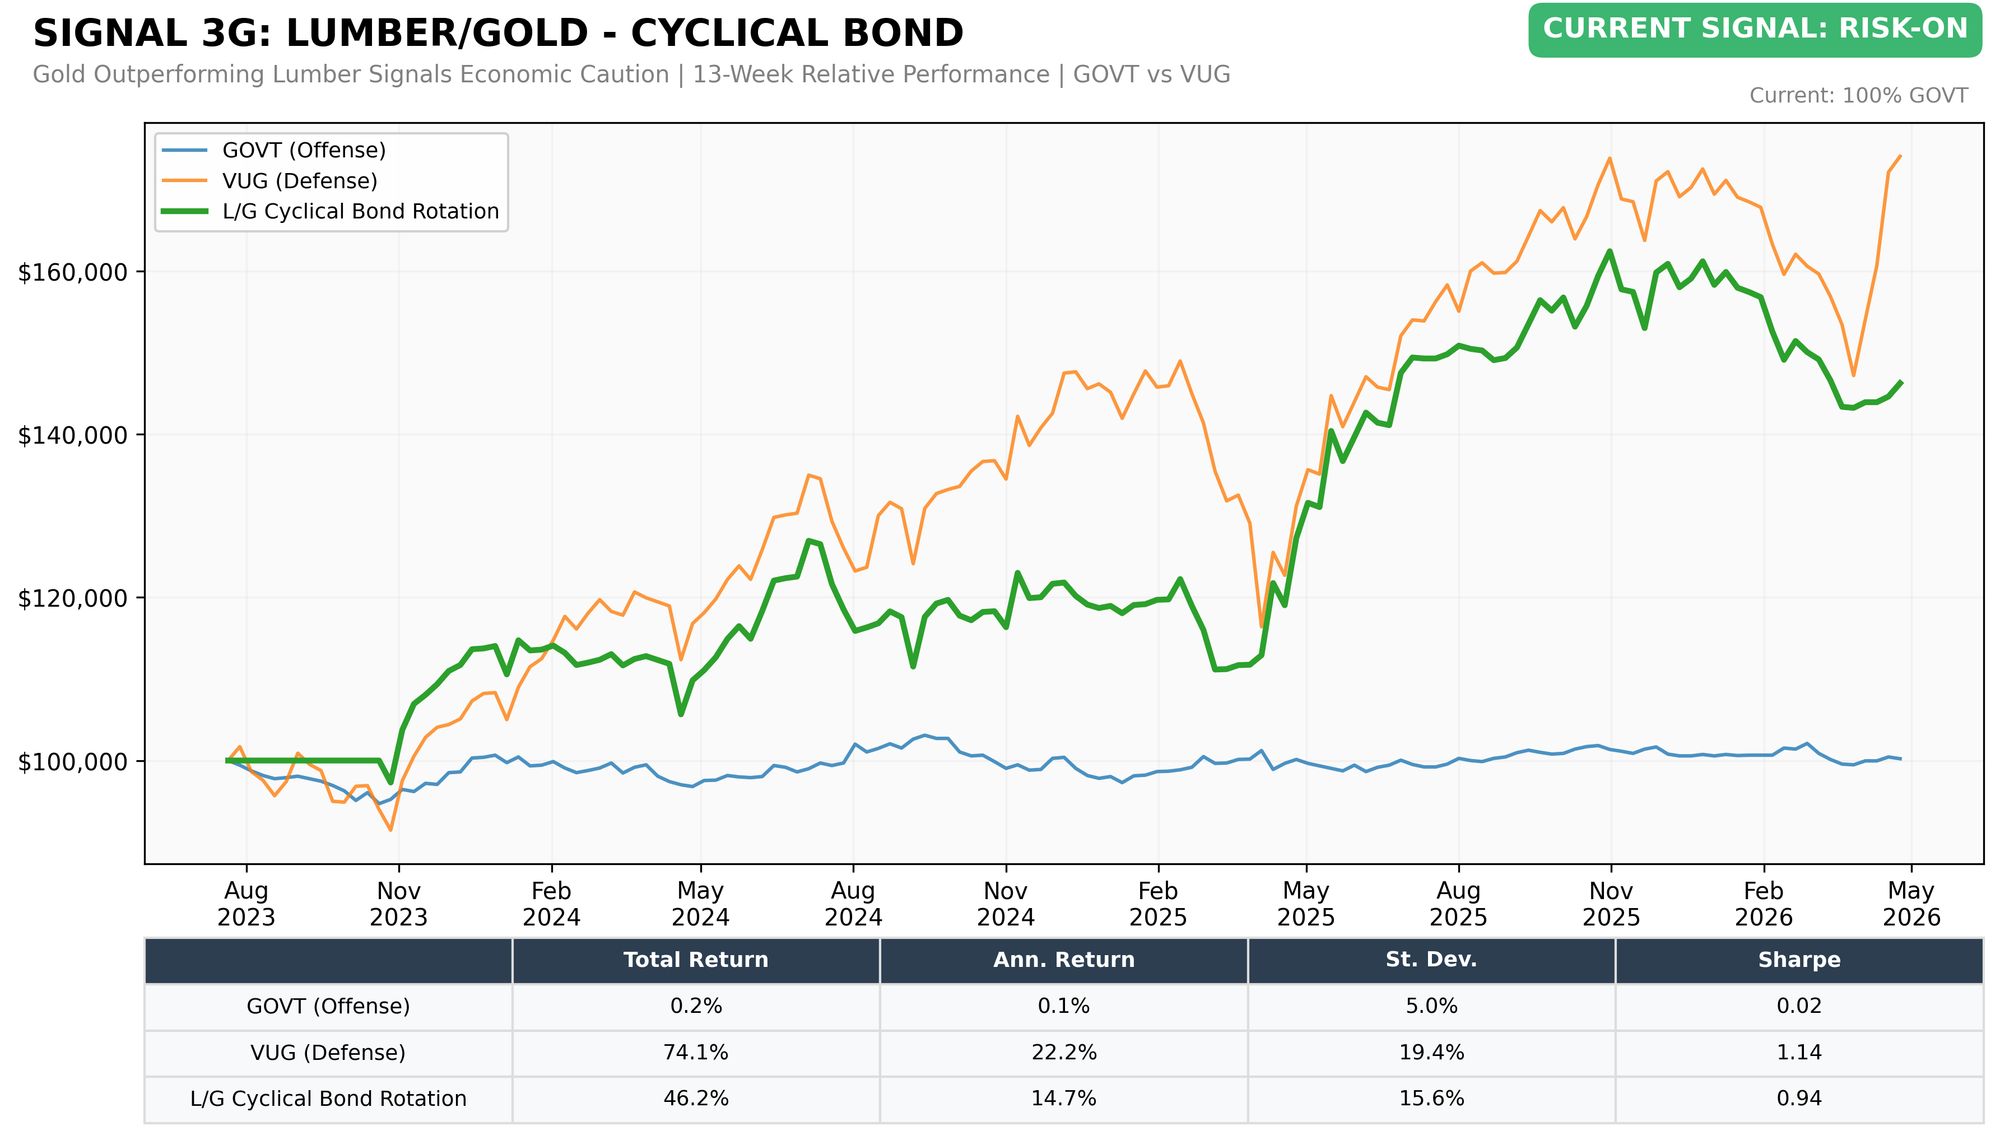
Current Allocation: 100% Risk-On across all 7 sub-strategies (offensive positioning)
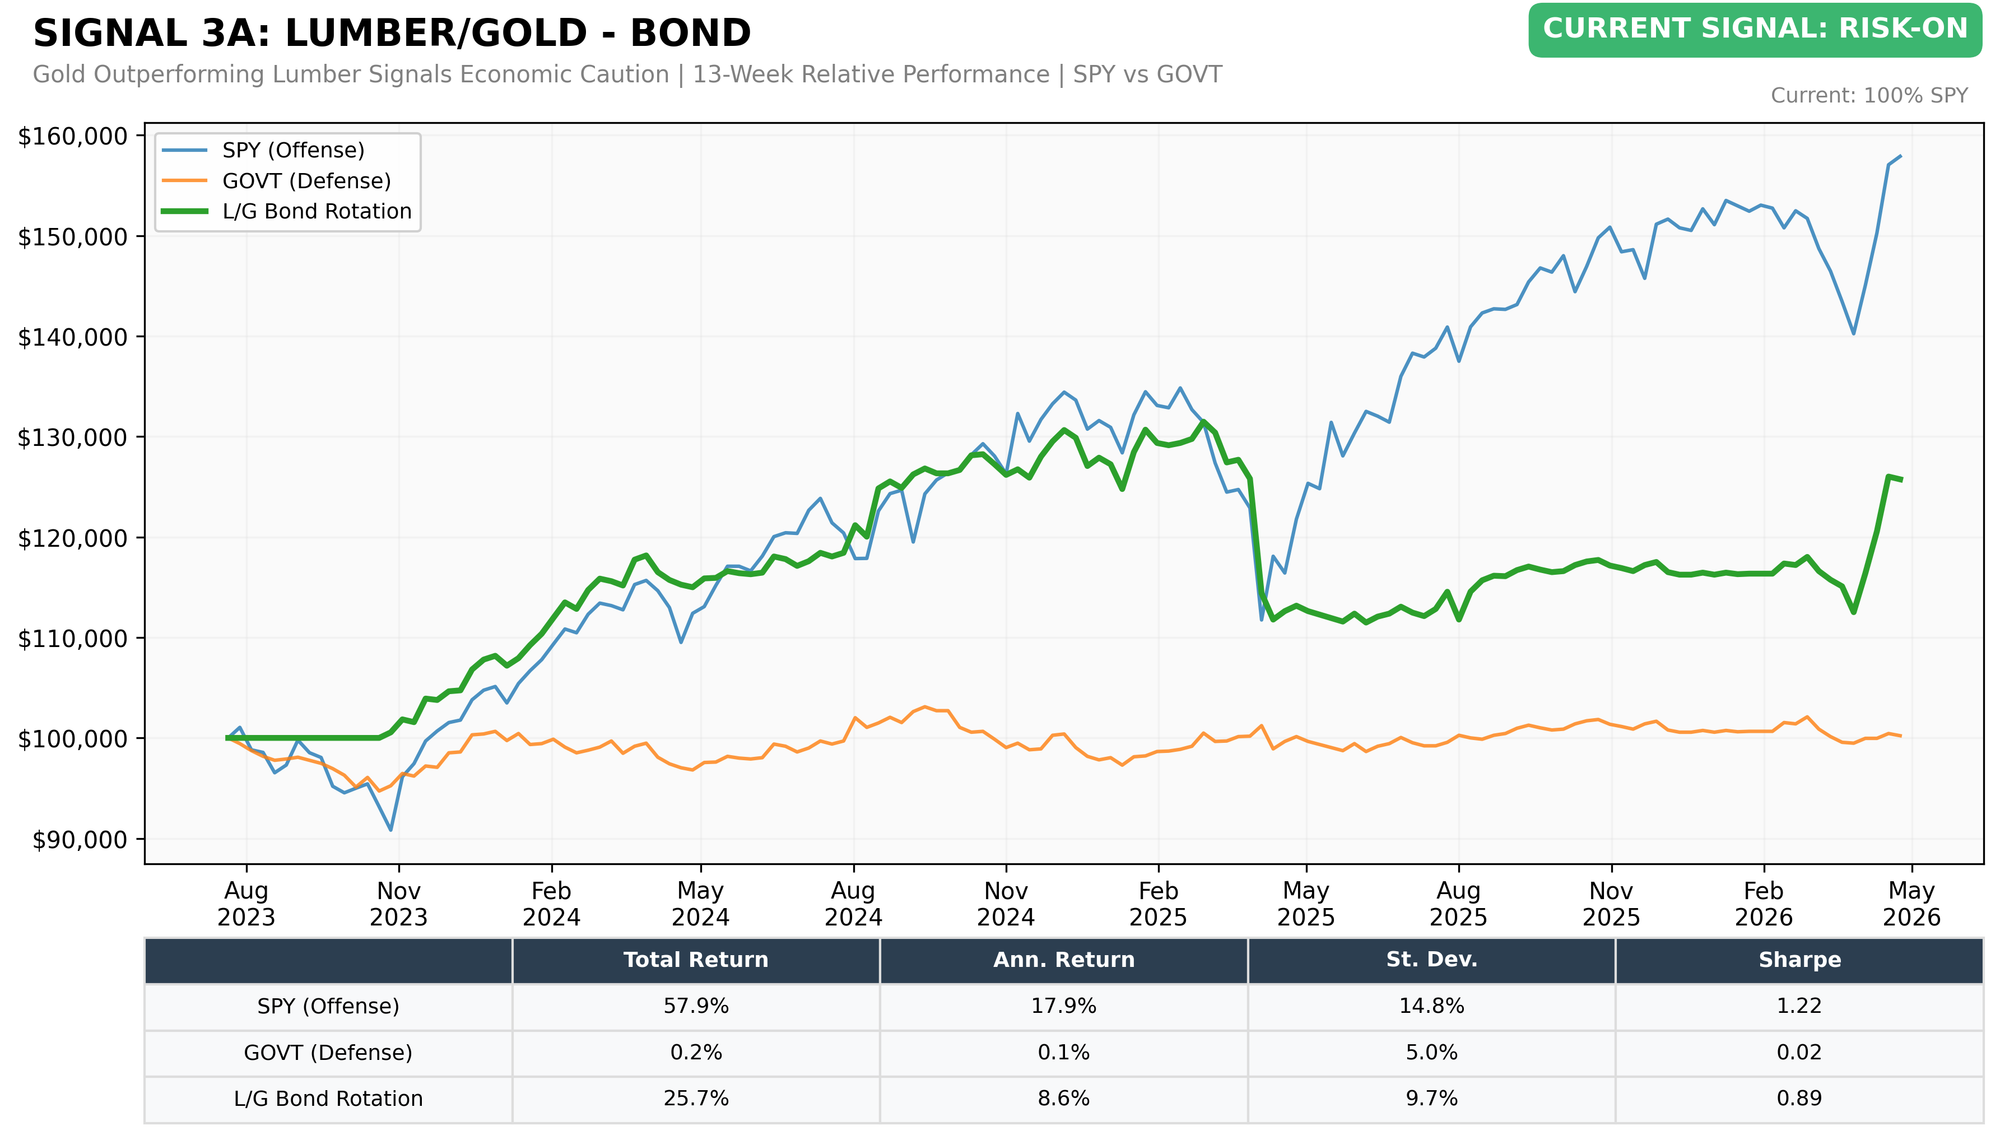
Reading the chart: Lumber now outperforming Gold over 13 weeks. All 7 sub-strategies have rotated to offensive positioning.
Lumber/Gold Buy-Write (SPY vs PBP)
Lumber/Gold Low Volatility (SPY vs SPLV)
Lumber/Gold Small-Cap (SPY vs VSMAX)
Lumber/Gold High Beta (SPY vs SPHB)
Lumber/Gold Cyclical Growth (SPY vs VUG)
Lumber/Gold Cyclical Bond (GOVT vs VUG)
Signal 4: Leverage for the Long Run
Based on: “Leverage for the Long Run (SSRN 2741701)”
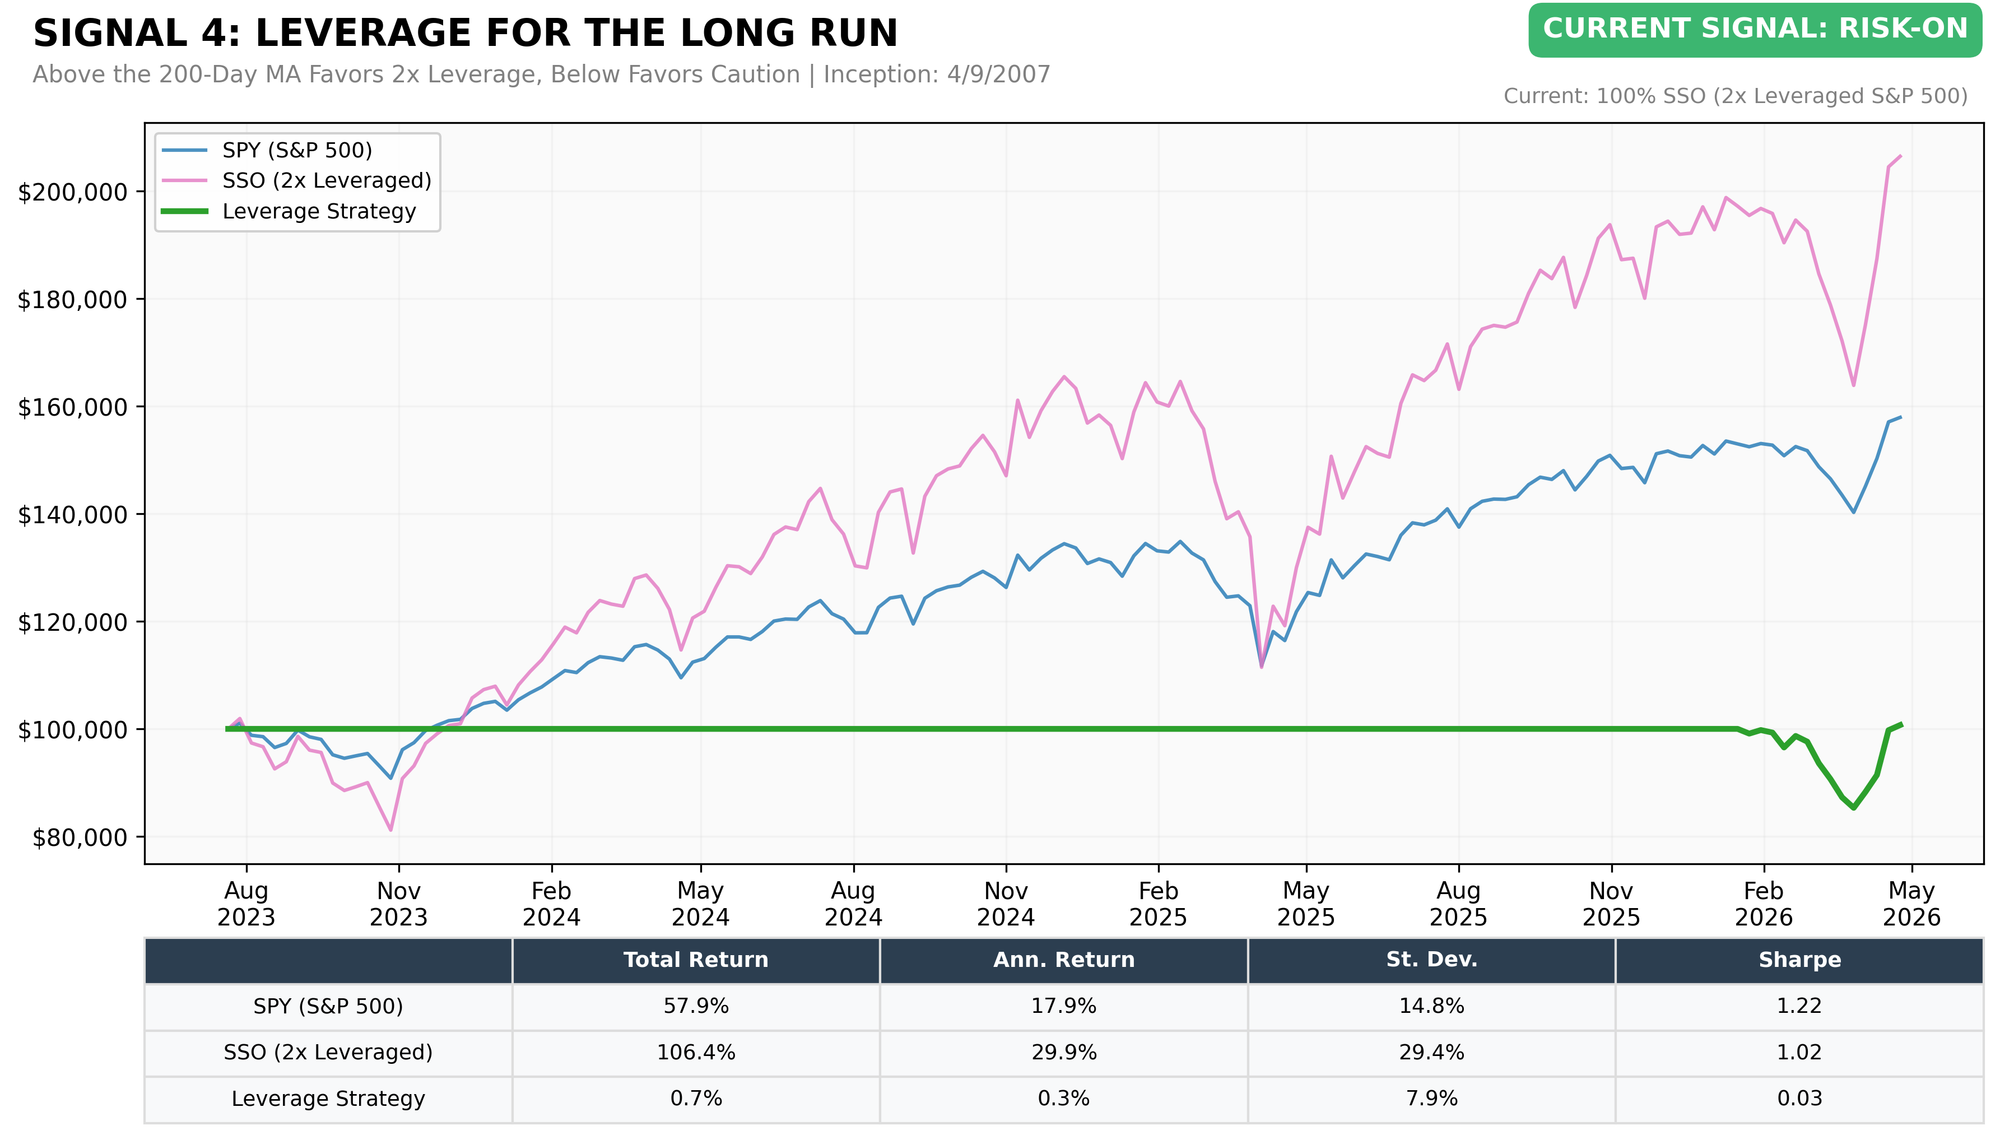
Target Investor: Aggressive investors with a long time horizon who are comfortable with leveraged equity exposure. This signal uses the S&P 500's position relative to its 200-day simple moving average to switch between 2x leveraged S&P 500 exposure (SSO) and unlevered SPY.
Current Indicator: RISK-ON
Conviction: 78/100 · Regime age: ~3 months (100 days)
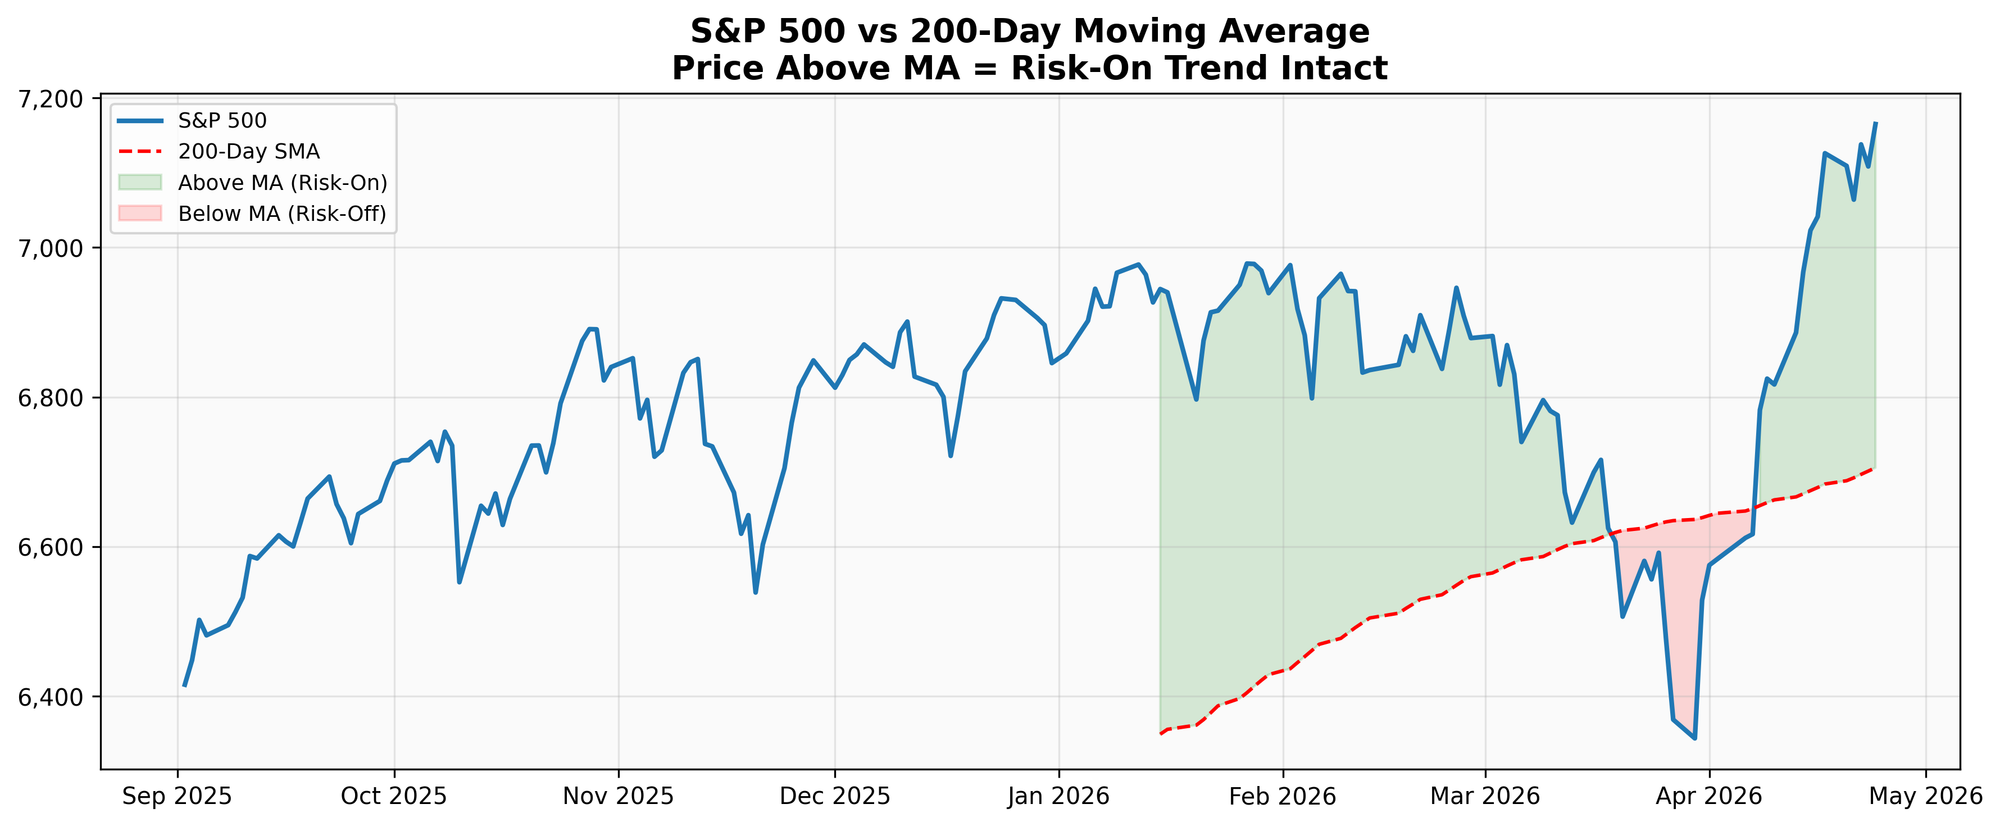
What would flip this signal: Signal flips RISK-OFF when the S&P 500 closes below its 200-day SMA of 6,987 (today 7,458, +6.7%).
Prior RISK-ON regimes: May 2025–Mar 2026 (310d), Mar 2025 (1d), May 2024–Mar 2025 (308d).
S&P 500 Close: 7,457.69 • 200-Day SMA: 6,987.23 • Spread: +6.73% above the 200-day moving average
Current Allocation: 100% SSO (ProShares Ultra S&P 500, 2x leveraged)
Reading the chart: S&P 500 at 7,457.69. 200-day SMA at 6,987.23. Flip threshold: SPX closes below SMA. Current cushion: +6.73 percentage points.
Conclusion & Allocation Guidance
The framework reads 2-2 Risk-On this week. Two of four signals favor risk-on positioning and two flag defense. The S&P 500 at 7,457.69 sits +6.7% above its 200-day moving average of 6,987.23, so the primary trend gauge remains intact. Underneath that, Beta Rotation and Treasury Rotation have both moved defensive. Lumber/Gold and the 200-Day MA remain offensive. The composite score of +15 on the −100/+100 scale is a mild tilt toward risk-on, but the mixed reading is the story.
Bottom Line: Maintain the framework's allocations as called this week. Signal 4 (RISK-ON) calls for 100% SSO (2x leveraged S&P 500). Signal 1 (RISK-OFF) calls for 100% SPY. Signal 2 (RISK-OFF) calls for 100% long-duration Treasuries (VLGSX/TLT). Signal 3 (RISK-ON) calls for offensive positioning across all seven Lumber/Gold sub-strategies. The 2-2 split raises the odds of a directional resolution in the next two to four weeks. Signal 1 in particular has whipsawed three times in the last twelve readings, so the current RISK-OFF reading may not be durable. Discipline the sizing at the composite level; do not overreact to any single signal in the mixed state.
Deep Dive: Beta Rotation — Why Utilities Lead Defense
The Beta Rotation signal compares the 4-week price-ratio change of XLU (Utilities) versus SPY (S&P 500). Utilities are the lowest-beta sector in the S&P 500, which is why a change in their relative performance is such a reliable defensive tell inside the equity complex. When utilities lead over four weeks, it usually means the marginal buyer inside stocks is prioritizing capital preservation, dividend yield, and duration exposure over growth and cyclical earnings. That kind of internal rotation often precedes a broader defensive shift by other market participants, which is why the signal has historically caught the early phase of drawdowns before the S&P index itself breaks trend.
The current reading of +1.38% is not a dramatic defensive tilt — it's a modest one. The signal turned defensive three weeks ago and has whipsawed three times in the last twelve readings, meaning short reversals are common at these small spreads. Distance to flip is only 1.38 percentage points, and the required move in the XLU/SPY ratio is small (from 0.06077 to 0.05994). If the ratio compresses again on renewed equity strength, the signal will flip back to RISK-ON. Treat the current defensive read as a warning shot, not a full retreat.
This Deep Dive rotates across all four signals on a 4-week cycle. Next week's spotlight: Treasury Rotation — The Long-End Tell.
The Lead-Lag Report is provided by Lead-Lag Publishing, LLC. All opinions and views mentioned in this report constitute our judgments as of the date of writing and are subject to change at any time. Information within this material is not intended to be used as a primary basis for investment decisions and should also not be construed as advice meeting the particular investment needs of any individual investor. Trading signals produced by the Lead-Lag Report are independent of other services provided by Lead-Lag Publishing, LLC or its affiliates, and positioning of accounts under their management may differ. Please remember that investing involves risk, including loss of principal, and past performance may not be indicative of future results. Lead-Lag Publishing, LLC, its members, officers, directors and employees expressly disclaim all liability in respect to actions taken based on any or all of the information on this writing.