The Fed Isn't Data-Dependent. The Fed Is Treasury-Dependent.
Powell isn't waiting on inflation. He's waiting on an issuance machine that cannot survive a front-end cut. The Fed's reaction function has been captured by Treasury issuance mechanics — and the falsification condition is watchable.
Today’s Lead-Lag Report post is sponsored by Relative Sentiment
Today’s Lead-Lag Report post is sponsored by Relative Sentiment
The Relative Sentiment Tactical Allocation ETF is a flexible, multi-asset fund that invests across stocks, bonds, commodities, precious metals, and currencies. Its approach is guided by a research-based factor called relative sentiment — which tracks how optimistic or cautious professional investors are compared to individual investors. Studies show professionals tend to have an edge over time, and this ETF seeks to capture that insight by increasing exposure to areas where institutions are more optimistic and reducing exposure where they’re more cautious. Relative sentiment often complements trend-following strategies, helping create portfolios that may be more balanced and less prone to sharp swings.
The Fund's investment objectives, risks, charges and expenses must be considered carefully before investing. This and other important information is contained in the Prospectus and SAI, which may be obtained by following the links or by calling +1.215.882.9983. Please read the prospectus carefully before investing.
Investments involve risk. Principal loss is possible.
The Fund is distributed by PINE Distributors LLC.
ETFAC-4976143-11/25
DISCLAIMER – PLEASE READ: This is sponsored advertising content for which Lead-Lag Publishing, LLC has been paid a fee. The information provided in the link is solely the creation of Relative Sentiment. Lead-Lag Publishing, LLC does not guarantee the accuracy or completeness of the information provided in the link or make any representation as to its quality. All statements and expressions provided in the link are the sole opinion of Relative Sentiment. and Lead-Lag Publishing, LLC expressly disclaims any responsibility for action taken in connection with the information provided in the link.
The Fed Isn't Data-Dependent. The Fed Is Treasury-Dependent.
Powell Isn't Waiting on Inflation. He's Waiting on an Issuance Machine That Cannot Survive a Front-End Cut.
Everyone is watching the wrong reaction function. Every month the ritual repeats. The payroll print lands, the CPI print lands, the market reprices the odds of a September or December cut, and a thousand notes get written parsing whether the labor market has softened enough or inflation cooled enough to give Chair Powell cover. The entire apparatus assumes the Fed is solving the problem it says it is solving: a dual-mandate optimization over employment and prices. I think that framework quietly stopped describing reality some time ago.
Here is the claim I want to defend. The Fed's reaction function has been captured by Treasury issuance mechanics. Powell is not holding because inflation is stubborn. He is holding because a large front-end cut collapses money-market fund yields, forces a rotation out of the single largest pool of parked cash in the system, and triggers a reallocation the Treasury cannot underwrite while it is trying to roll trillions of dollars of maturing debt through a shrinking base of duration buyers. Fiscal dominance is not coming. It is already here, running through the Fed's asymmetric preference for holding over cutting.
The Consensus Framework and What It Misses
Start with the story everyone accepts. The Fed is data-dependent. It reads incoming prints on employment and inflation, forms a view on whether policy is restrictive enough, and adjusts. In its own June framing, the committee held the target range at 3.50 to 3.75% and continued to describe policy as modestly restrictive, waiting for further evidence that inflation is returning to target.[1] The market takes that at face value. The consensus trade is to wait for the unemployment rate to breach roughly 4.5%, or for core inflation to settle convincingly below 2.5%, and then to front-run the easing cycle that supposedly follows.
What that framework misses is the plumbing underneath the mandate. A central bank does not set policy in a vacuum. It sets policy against a fiscal authority that has to sell an enormous and growing quantity of debt into the same market the central bank is trying to steer. When the fiscal footprint is small, the two problems are separable and the data-dependence story holds. When the fiscal footprint is large enough that the marginal cost of funding the government becomes a first-order constraint, the two problems fuse. The central bank cannot optimize over employment and prices without also, implicitly, optimizing over the government's ability to finance itself. That is the definition of fiscal dominance, and the arithmetic says we are inside it.
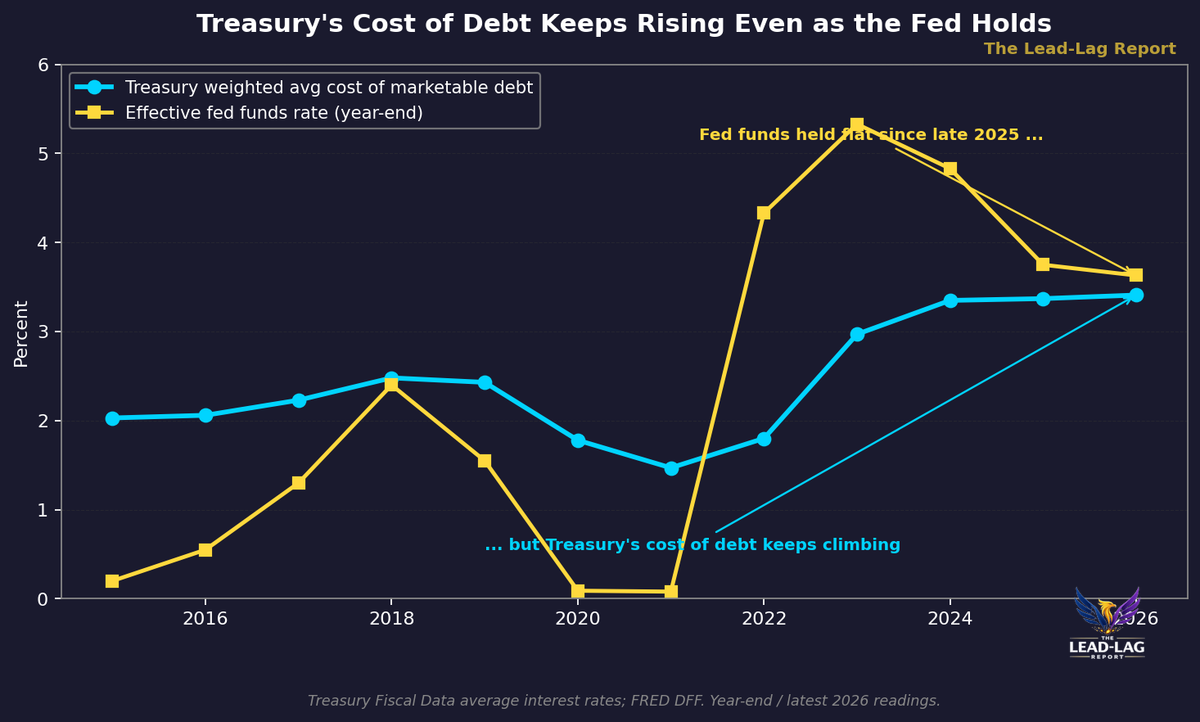
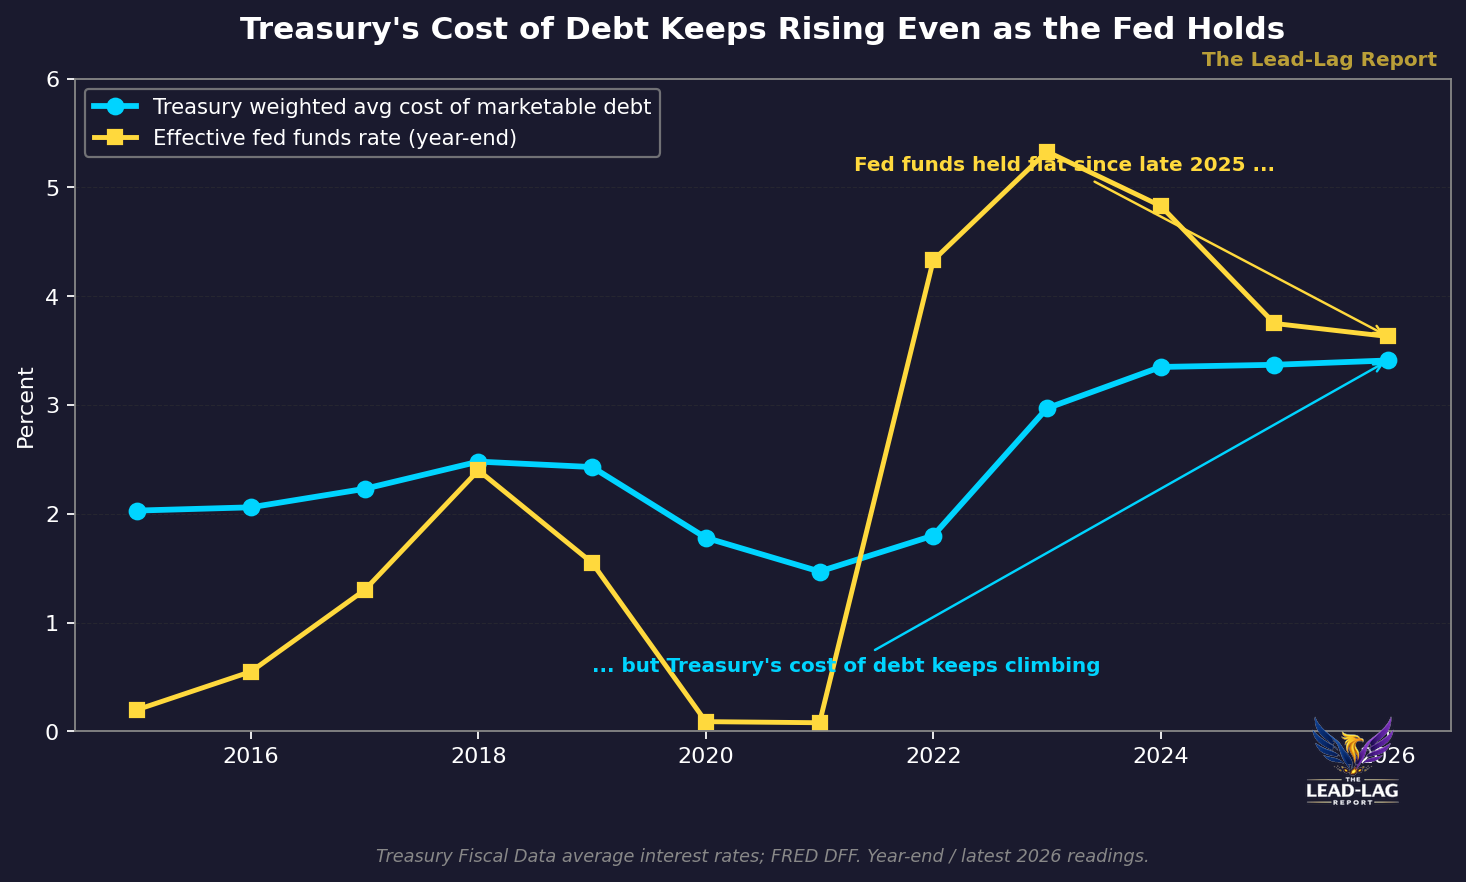
The clearest tell is in the first chart. The Treasury's weighted average interest rate on marketable debt has climbed to 3.41% as of June 2026, up from a 1.47% trough in 2021 and 3.32% only four months earlier in February.[2] The effective fed funds rate, meanwhile, has been essentially flat around 3.63% since late 2025.[3] The government's cost of debt is rising even though the policy rate is not. That is the signature of a maturity wall repricing older, cheaper debt into today's higher-rate environment, and it means the fiscal constraint tightens every single month regardless of what the FOMC decides.
The Rolling Debt Mountain and the Arithmetic of a Cut
Consider the scale of what the Treasury has to refinance. Roughly 40% of all marketable debt matures between January 2026 and June 2027, an amount on the order of $9 to $10 trillion that has to be rolled over.[4] A large share of that vintage was issued between 2019 and 2024 at coupons well below 2.5%, and it is being replaced at prevailing rates north of 4% at the belly and long end, and in the high-3s at the front.[5] The bills that fund the near-term deficit are rolling at a secondary market discount rate of about 3.73% as of June 2026.[6] Every roll is a rate reset upward. The weighted average cost keeps climbing not because the Fed is tightening but because the arithmetic of the maturity ladder guarantees it.
Now run the arithmetic of a cut through the Treasury's lens rather than the Fed's. A 50 basis point reduction in the front end lowers the marginal cost of the bill stock and the near-dated coupon rolls. Against a bill and short-coupon base measured in the trillions, that is real money, on the order of tens of billions of dollars in annual interest saved on the portion of debt that reprices quickly. From a pure debt-service standpoint, the Treasury wants the front end lower. That is the seductive part of the argument, and it is why the naive version of fiscal dominance predicts the Fed should be cutting aggressively to help the fiscal authority.
But the debt-service saving is only one side of the ledger, and it is the smaller side. The larger consequence of a front-end cut is what it does to the demand side of the auction. Cheap short rates are exactly what has anchored the enormous cash pile that is currently absorbing the bill supply. Cut the front end hard and you knock the legs out from under that pile at the precise moment the Treasury needs it most. The Fed's problem is not the interest the Treasury pays. It is who buys the next auction when the marginal cash buyer walks away.
The Money-Market Fund Trap
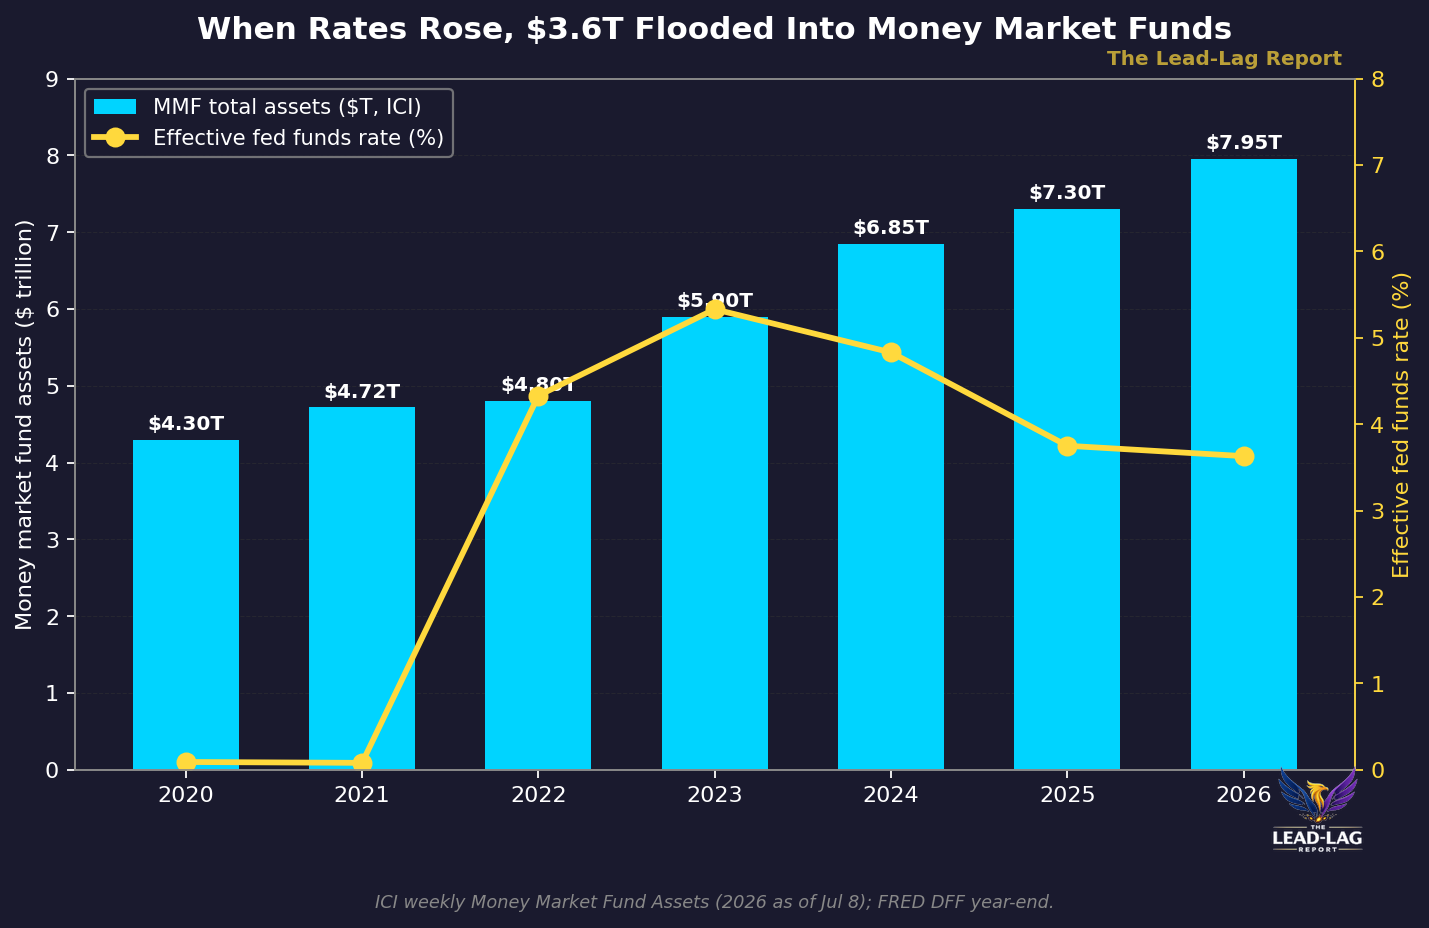
Money market fund assets hit a record $7.95 trillion for the week ended July 8, 2026.[7] That is not an accident. It is the direct product of a front end that pays a competitive, near-riskless yield. When the reverse repo facility drained toward zero over 2025 and into 2026, the cash that had been parked at the Fed did not vanish; it migrated into government money funds and, through them, into the bill market.[8] Those funds are now among the most important marginal buyers of Treasury bills. The second chart shows the mechanism plainly: as the fed funds rate spiked in 2022, money fund assets climbed by more than $3.6 trillion, from roughly $4.3 trillion to nearly $8 trillion today.
Here is the trap. Money market fund yields track the front end almost mechanically. A 50 basis point cut in the policy rate flows through to fund yields within weeks. When the spread between a money fund and a short-duration bond fund or a dividend equity compresses, a predictable share of that $7.95 trillion starts looking for a better home. History says the rotation is real: the last two sustained easing cycles both pulled hundreds of billions of dollars out of money funds into duration and risk. The problem this time is where that money can actually go.
It cannot comfortably go into long-duration Treasuries, because the auction demand for duration is already thin and the term premium is repricing higher, not lower. It cannot go into credit without compressing spreads that are already historically tight. And if it goes into equities, it inflates exactly the asset-price risk the Fed spends its every communication trying to avoid stoking. The Fed is caught. A cut that helps the Treasury's interest bill simultaneously dislodges the buyer base the Treasury depends on and pushes the freed-up cash toward the two destinations the central bank least wants to see it go. Holding is the path of least resistance, and it is being chosen for reasons that have nothing to do with the inflation print.
What the Auction Data Is Actually Telling Us
If the thesis is right, it should show up where supply meets demand: at the auction. It does. The 10-year note bid-to-cover ratio printed 2.13x at the July 13, 2026 reopening, described by dealers as demand that had softened over the prior three months from 2.45x to 2.13x.[9] That is below the roughly 2.5x level that has historically signaled comfortable demand, and it sits at the low end of the recent range. The third chart plots the quarterly path since 2022. The individual prints are noisy, as auctions always are, but the trend line drifts lower even as issuance sizes have been held steady or nudged higher.
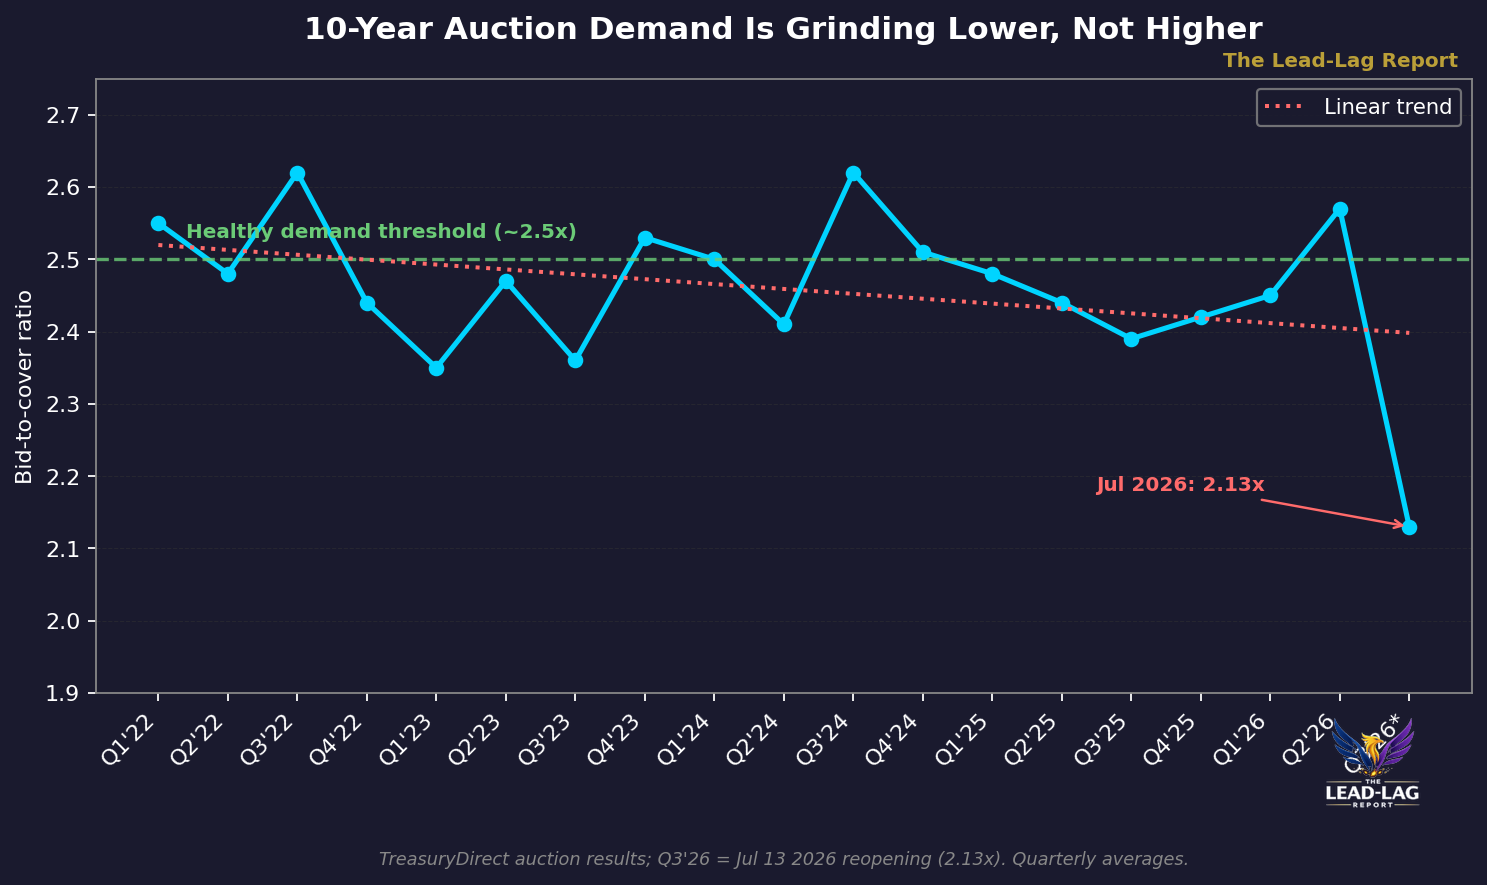
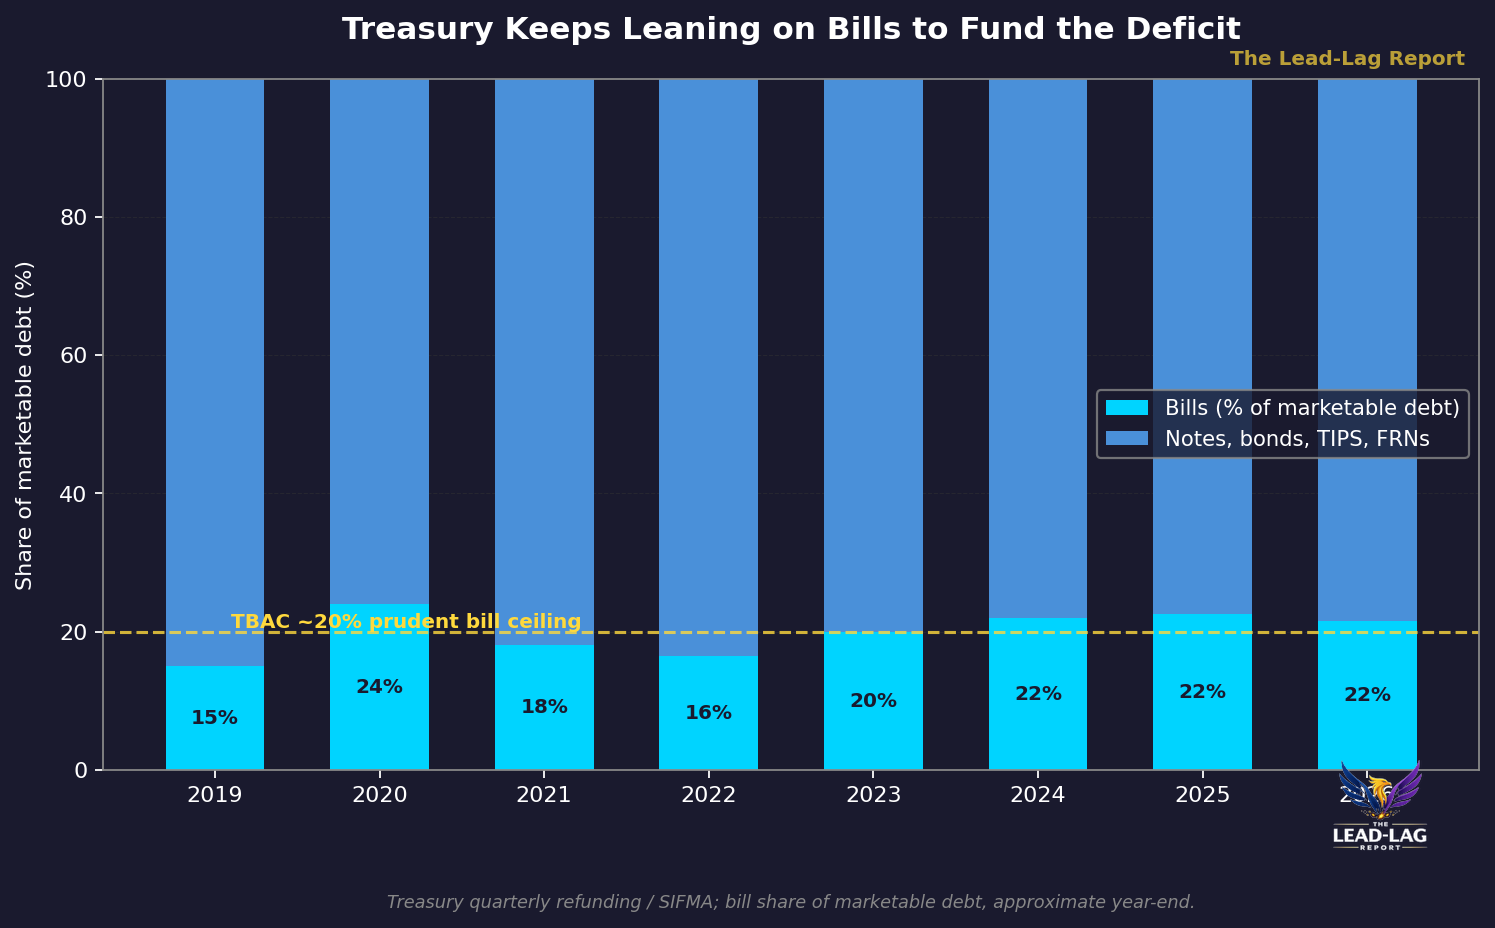
The composition of demand matters as much as the headline ratio. Two of the three largest traditional duration buyers are stepping back. Foreign official holders have been flat to declining as reserve managers diversify, and the Federal Reserve itself is a net seller as its balance sheet runs off. That leaves price-sensitive domestic buyers, primary dealers, and the leveraged basis trade to clear the supply, and each of those demands a higher yield or thinner concession to show up. This is why the Treasury has leaned so heavily on bills, as the fifth chart shows: the bill share of marketable debt has sat around 21 to 22%, at or above the roughly 20% ceiling the Treasury's own borrowing advisory committee has historically treated as prudent.[10] Bills get absorbed by the money funds. Coupons have to find real duration buyers, and those are getting scarce.
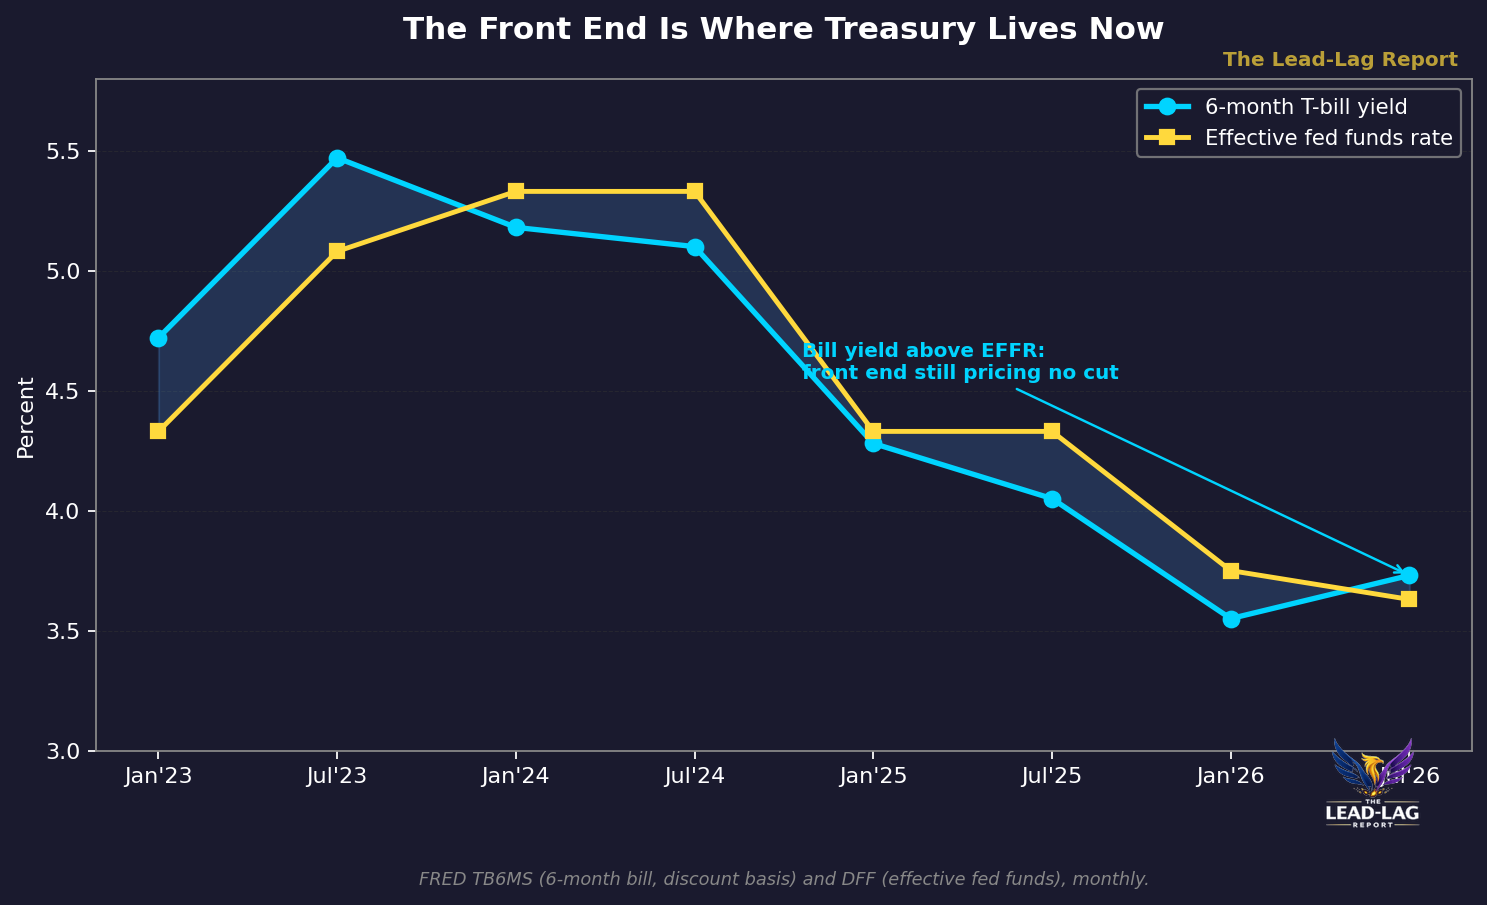
So the front end is now the load-bearing wall of the entire financing operation. The fourth chart shows the six-month bill yield sitting slightly above the effective fed funds rate through mid-2026, a front end that is still pricing no imminent cut.[11] That is not the market being slow. It is the market reading the same constraint I am describing. As long as the Treasury needs the money funds to keep buying bills, the front end has to keep paying, and the Fed has to keep the front end where the money funds want it.
The Falsification Condition
A thesis that cannot be wrong is not worth writing. So here is the specific, observable condition that would tell me I have this backwards. If the Fed cuts 50 basis points or more, and both of the following hold, the thesis is falsified. First, money market fund assets stay flat or grow rather than bleeding out. Second, the 10-year auction bid-to-cover ratio stays above 2.5x for three consecutive months. If both of those are true after a real cut, then the market can absorb the rotation, the buyer base is deeper than I think, and the Fed genuinely was just data-dependent all along. I would write that piece and retire this one.
The reason I do not expect to is that the two conditions are in tension with each other. If money funds hold their assets after a cut, it means the front end is still paying enough to keep the cash parked, which means the cut was not really transmitted, which is itself evidence of the capture. And if the cut does transmit and money funds bleed, the auction demand for duration has to absorb both the existing supply and the reallocating cash at exactly the moment bid-to-cover is already sliding toward 2.1x. The falsification condition requires the system to do two things it has been visibly struggling to do. Watch those two series together. They are the tell.
The consensus is reading the Fed's mandate off the press statement. The constraint that actually binds is on the Treasury's auction calendar, and it is tightening on its own schedule no matter what the labor market does. Read the issuance, not the dot plot. The Fed already told you which one it answers to.
Few understand this.
Notes
[1] Federal Reserve, FOMC statement and Implementation Note, June 17, 2026. federalreserve.gov. Target range for the federal funds rate held at 3.50 to 3.75%.
[2] U.S. Department of the Treasury, Fiscal Data, Average Interest Rates on U.S. Treasury Securities. As reported by the Congressional Joint Economic Committee monthly debt update: average interest rate on total marketable debt 3.411% in June 2026, 3.375% a year earlier, 1.472% five years earlier. jec.senate.gov. Trough of approximately 1.47% recorded in 2021.
[3] Federal Reserve H.15 Selected Interest Rates and FRED series DFF (Effective Federal Funds Rate). Effective rate approximately 3.63% in July 2026, target range 3.50 to 3.75%. fred.stlouisfed.org/series/DFF.
[4] Estimates of the 2026 maturity wall: approximately $9 to $10 trillion of marketable Treasury debt maturing in 2026, with roughly 40% of marketable debt maturing between January 2026 and June 2027. See DoubleLine, 'Treasury Briefing: Trump, the Fed and Maturity Walls,' September 2025, doubleline.com; and SIFMA U.S. Treasury Securities Statistics (outstanding marketable Treasury debt approximately $31.1 trillion as of June 2026), sifma.org.
[5] Maturing vintage coupons of approximately 0.8% to 2.5% (2019-2024 issuance) being refinanced at estimated replacement rates near 4.0% to 4.3%. Daily Treasury Par Yield Curve Rates, U.S. Department of the Treasury. home.treasury.gov.
[6] FRED series TB6MS, 6-Month Treasury Bill Secondary Market Rate, Discount Basis. June 2026: 3.73%. fred.stlouisfed.org/series/TB6MS.
[7] Investment Company Institute, weekly Money Market Fund Assets release, July 9, 2026. Total money market fund assets of $7,953.06 billion for the week ended Wednesday, July 8, 2026, a record high. ici.org.
[8] Federal Reserve overnight reverse repurchase (ON RRP) facility balances declined toward zero through 2025 and into early 2026 as cash migrated into government money market funds and bills. Coverage: WolfStreet, January 5, 2026, wolfstreet.com. FRED series RRPONTSYD, fred.stlouisfed.org/series/RRPONTSYD.
[9] U.S. 10-year Treasury note auction results. Bid-to-cover 2.13x at the July 13, 2026 reopening, described as a decline from 2.45x over the prior three months. Dukascopy Bank auction analysis, July 13, 2026, dukascopy.com. Prior prints: 2.45x (March 2026) and 2.57x (June 10, 2026 reopening on $39B). TreasuryDirect auction archive: treasurydirect.gov.
[10] Treasury Quarterly Refunding Statement, February 4, 2026 and May 6, 2026, U.S. Department of the Treasury. home.treasury.gov. Treasury confirmed it would maintain nominal coupon and FRN auction sizes for at least the next several quarters, continuing a bill-heavy financing stance. Bill share of marketable debt of approximately 20 to 22% referenced against the Treasury Borrowing Advisory Committee's historical guidance of roughly 20%. SIFMA U.S. Treasury Securities Statistics: sifma.org.
[11] FRED series TB6MS (6-month bill, discount basis) and DFF (effective fed funds rate), monthly, 2023-2026. Six-month bill of 3.73% versus effective fed funds of approximately 3.63% in mid-2026. fred.stlouisfed.org/series/TB6MS and fred.stlouisfed.org/series/DFF.
[12] On the analytics of fiscal dominance and monetary-fiscal interaction, see Bank for International Settlements working papers on fiscal dominance and sovereign debt, e.g. BIS Working Papers series, bis.org/publ/work.htm.
The Lead-Lag Report is provided by Lead-Lag Publishing, LLC. All opinions and views mentioned in this report constitute our judgments as of the date of writing and are subject to change at any time. Information within this material is not intended to be used as a primary basis for investment decisions and should also not be construed as advice meeting the particular investment needs of any individual investor. Trading signals produced by the Lead-Lag Report are independent of other services provided by Lead-Lag Publishing, LLC or its affiliates, and positioning of accounts under their management may differ. Please remember that investing involves risk, including loss of principal, and past performance may not be indicative of future results. Lead-Lag Publishing, LLC, its members, officers, directors and employees expressly disclaim all liability in respect to actions taken based on any or all of the information on this writing.