Semis Sank. Banks Blew Out. Iran Got Loud.
When credit refuses to confirm a sell-off and geopolitics refuses to stay in the background, which signal is the market actually telling you to trust?
Today’s Lead-Lag Report post is sponsored by Alexis Investment Partners
Today’s Lead-Lag Report post is sponsored by Alexis Investment Partners
The Alexis Practical Tactical ETF (LEXI) is a multi-asset, model-informed tactical allocation ETF managed by father-daughter team Jason Browne and Alexis Browne Roberts. The Practical Tactical framework was built to address sequence of returns risk in an aging secular bull market — participating more in up than down markets, pursuing leading sectors and regions while minimizing exposure to laggards, and incorporating a broader range of asset classes and strategies than traditional balanced portfolios. To learn more about the ETF, visit www.lexietf.com. Access AIP’s media content, monthly newsletter, and learn more about Practical Tactical investing at www.alexisinvests.com.
Before investing carefully consider the fund’s investment objective, risks, charges, and expenses contained in the prospectus available at www.lexietf.com. Please read the prospectus carefully.
Investing involves risk including possible loss of principal.
Distributor: Foreside Fund Services, LLC.
DISCLAIMER – PLEASE READ: This is sponsored advertising content for which Lead-Lag Publishing, LLC has been paid a fee. The information provided in the link is solely the creation of Alexis Investment Partners. Lead-Lag Publishing, LLC does not guarantee the accuracy or completeness of the information provided in the link or make any representation as to its quality. All statements and expressions provided in the link are the sole opinion of Alexis Investment Partners and Lead-Lag Publishing, LLC expressly disclaims any responsibility for action taken in connection with the information provided in the link.
Semis Sank. Banks Blew Out. Iran Got Loud.
When credit refuses to confirm a sell-off and geopolitics refuses to stay in the background, which signal is the market actually telling you to trust?
Key Highlights
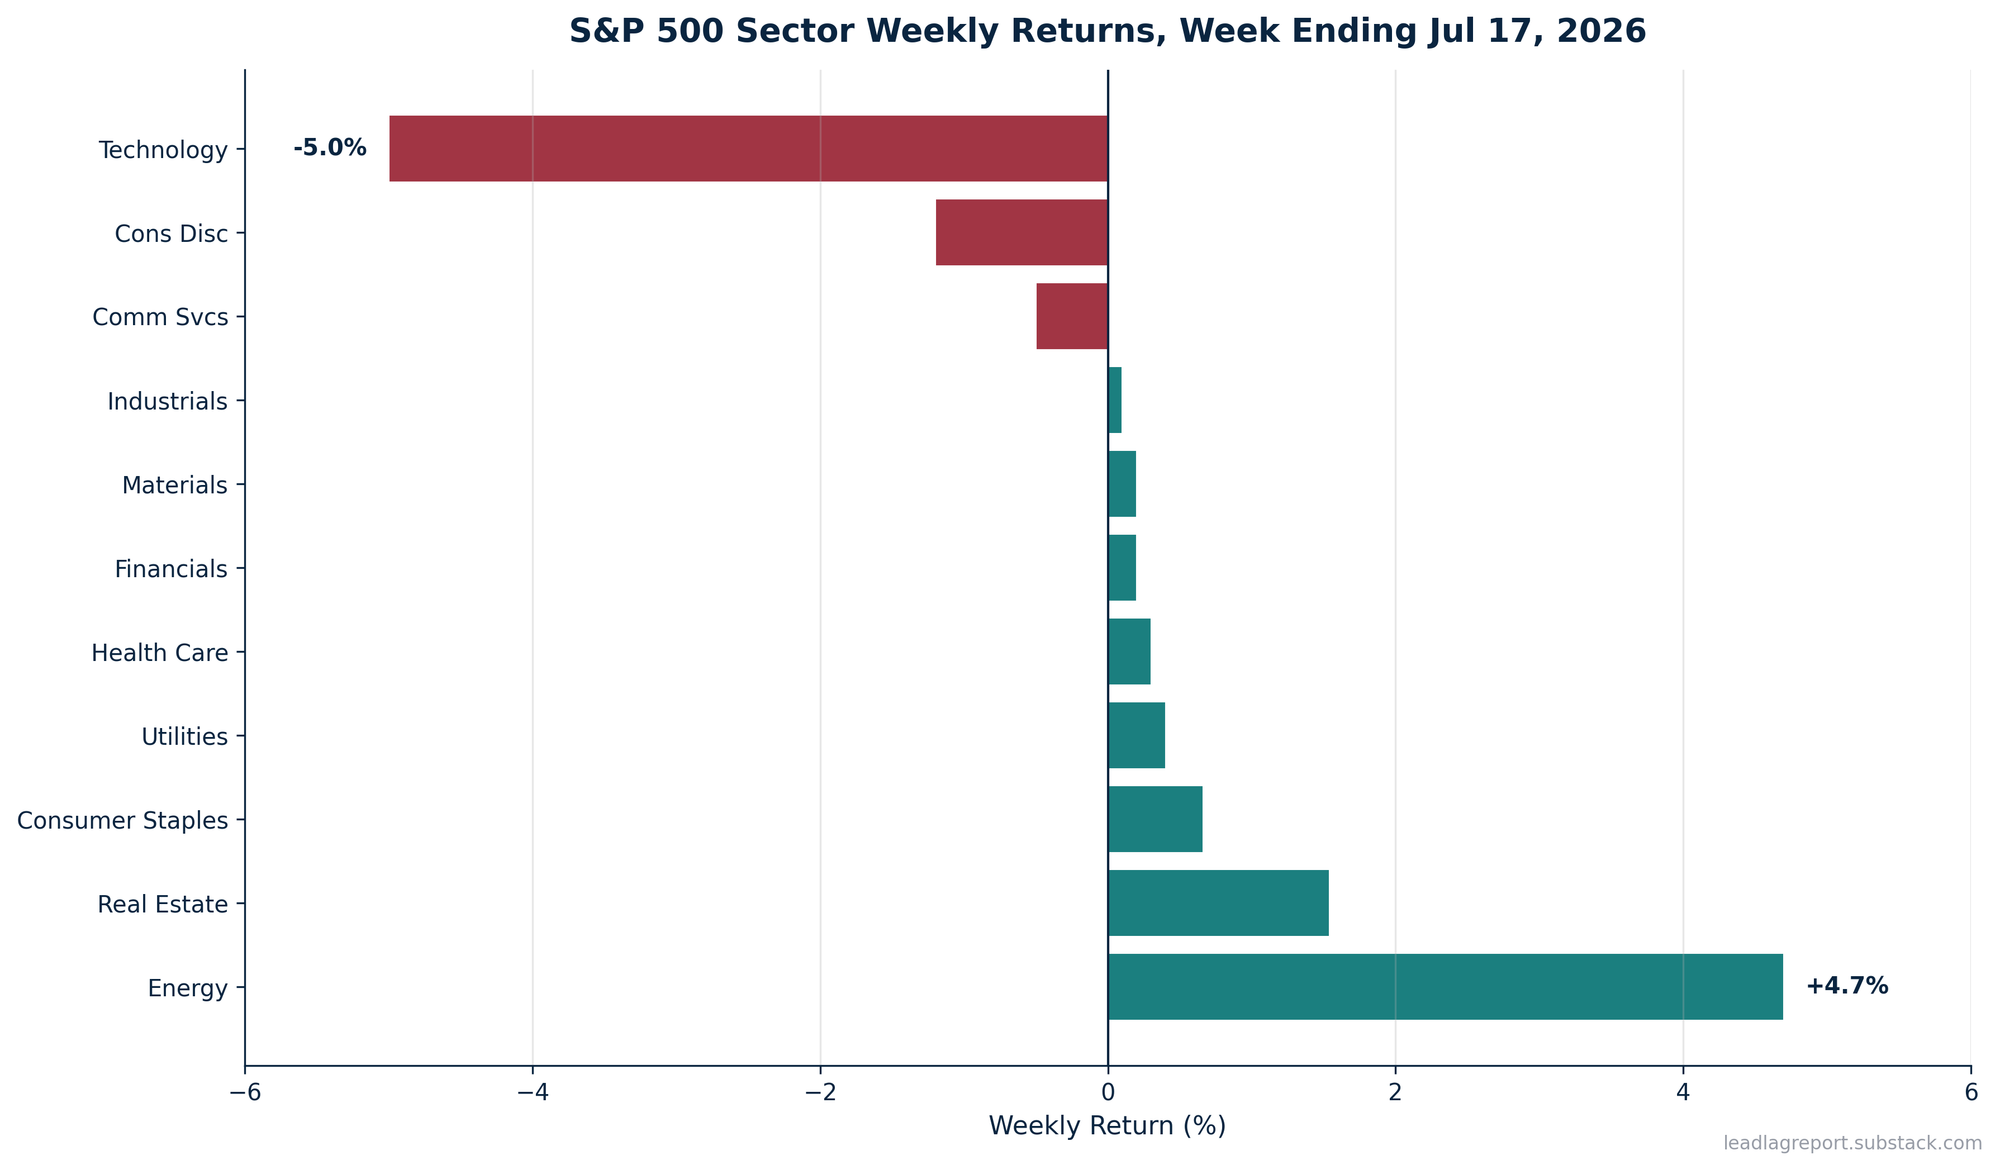
- Nasdaq fell 2.9% and technology dropped roughly 5% on the week, the first losing week for the S&P 500 in three, while energy jumped 4.7% and financials led on record big-bank earnings1.
- Big-bank Q2 crushed: JPMorgan posted a record $21.2 billion quarterly net income, Goldman beat by more than 44%, and Big Five combined profits reached roughly $49 billion, up 39% year-over-year2.
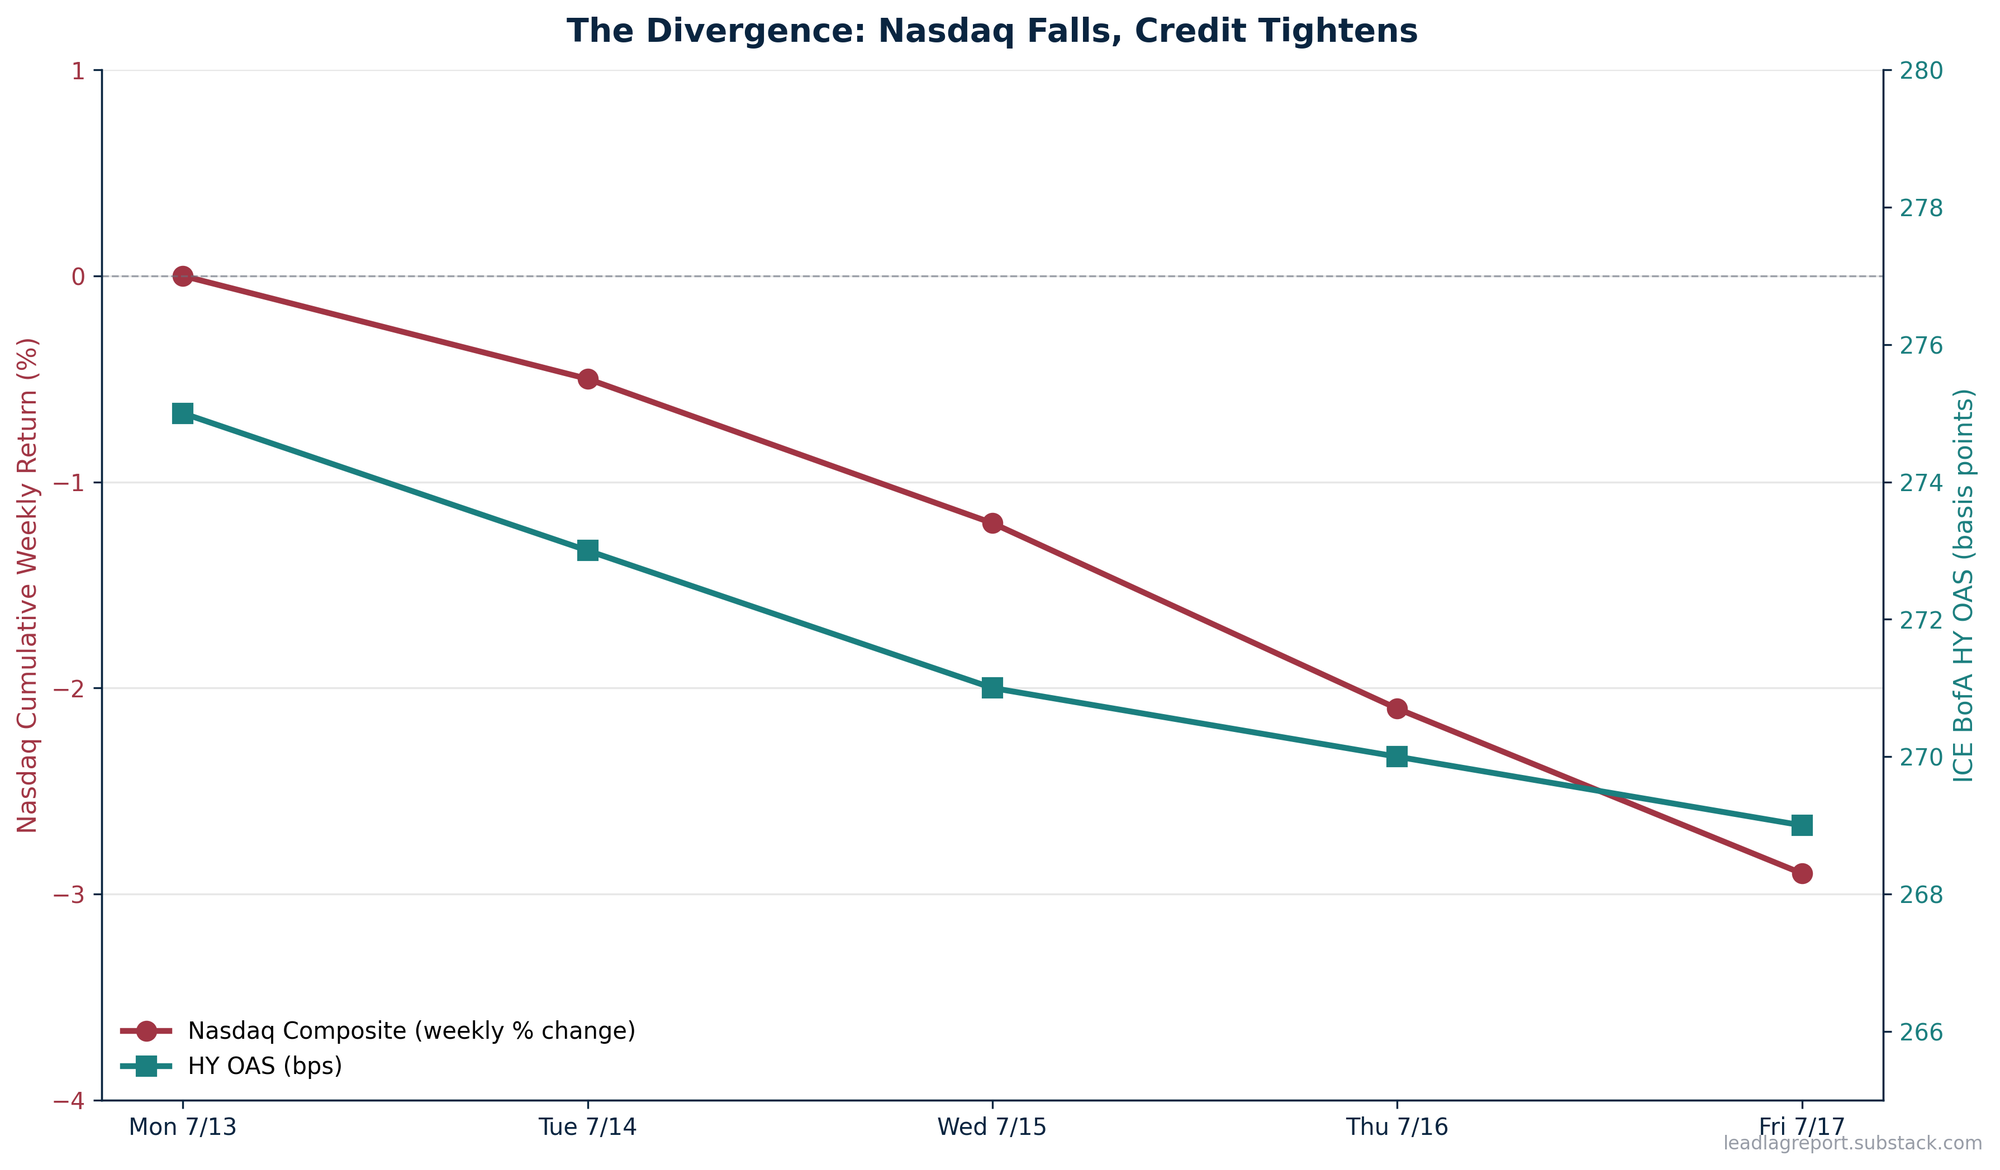
- Credit refused to confirm the equity anxiety. High-yield OAS tightened another 6 basis points to 269, and investment-grade held below 80 basis points for a third month, the longest such stretch since the 1990s3.
- The weekend rewrote the geopolitical premium. Two US service members were killed and one is missing in a Jordan base attack; CENTCOM ran a seventh consecutive night of strikes; Iran formally suspended the June memorandum of understanding and struck Kuwaiti infrastructure. Brent already closed Friday at roughly $88, up nearly 5% on the day, and Sunday open risk is skewed higher45.
THESIS STATUS
Standing thesis: Late-cycle divergences, credit calm alongside equity leadership rotation, are early warnings that the market's dominant narrative is being rewritten, not simply repriced.
This week's evidence: Semiconductor and mega-cap technology broke a multi-month trend while high-yield credit tightened and financials led on record earnings. Cool inflation prints landed against a hot oil tape, a hawkish Waller speech that faded within 48 hours, and a US-Iran escalation cycle that jumped from background risk to open kinetic exchange over the weekend.
Margin of confidence: Moderate to elevated. The dispersion is unambiguous. The Iran overlay adds a discrete tail risk that credit spreads have not yet acknowledged.
What would break it: A synchronized move, credit spreads widening past 320 basis points on high-yield while equities extend the sell-off, would collapse the divergence and confirm broader risk-off. A snap reversal in semiconductors on stronger AI capex guidance would make this week look like noise. A cease and de-escalation over the next 72 hours would compress the oil premium and let the rotation trade breathe. Any of the three is live.
The Surface Narrative
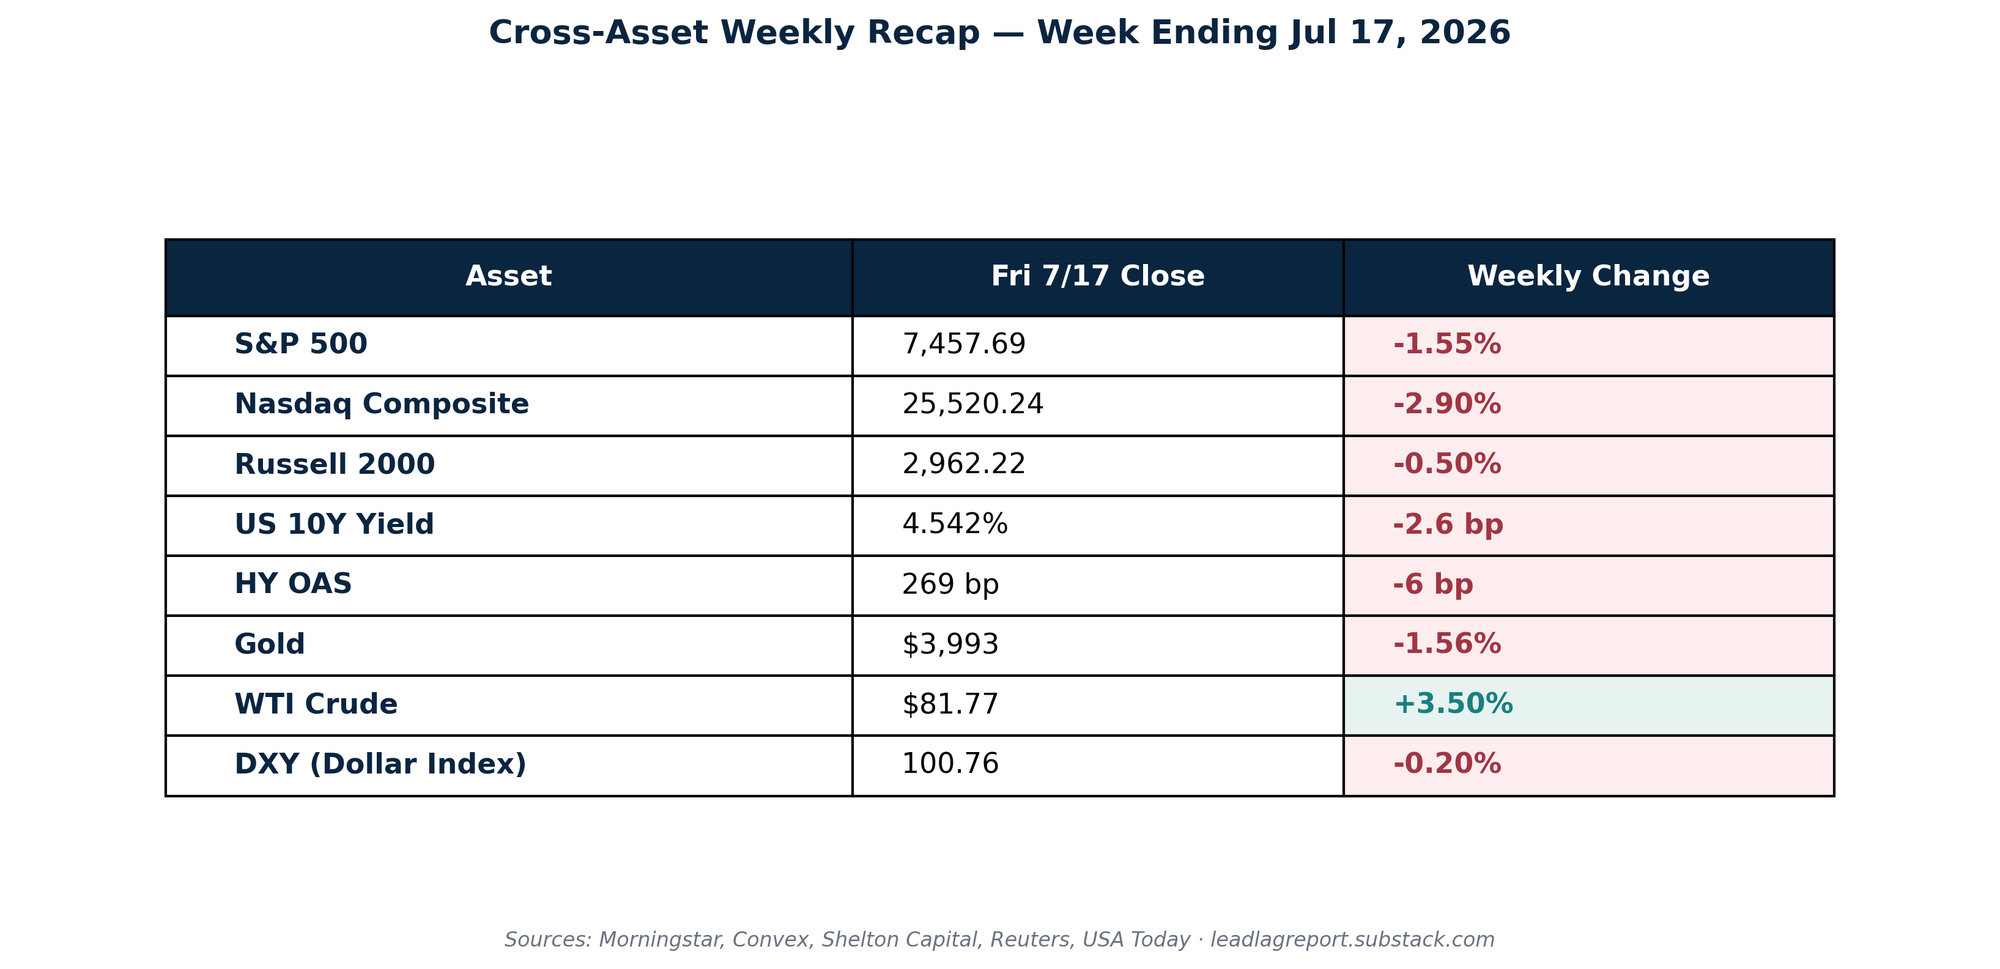
The tape looked ugly. Nasdaq off 2.9%6. Semis leading down, with technology as the worst sector at roughly negative 5%1. IBM off nearly 27% on the week, the biggest loser in the S&P 5007. Netflix printed a 52-week low near $68 after guiding third-quarter revenue below the Street and cutting the cadence of viewership disclosure89. The narrative wrote itself: the AI capex trade is finally rolling over, mega-cap concentration risk is starting to bite, and the geopolitical backdrop is adding a fresh reason to sell.
Sit with that story for a minute. It does not fit the rest of the data.
Consider what happened in credit. The ICE BofA high-yield OAS tightened another six basis points on the week to 269, near a 52-week low of 2633. Investment-grade spreads held around 76 basis points, extending a three-month run below 80, the longest since the 1990s according to Raymond James10. If the equity sell-off was signaling stress in the real economy, and if the market truly believed the weekend's escalation would extend, high-yield would have widened. It did the opposite.
Financials tell the same story from a different angle. Combined Big Five profits came in around $49 billion for the quarter, up 39% year-over-year11. JPMorgan posted $21.2 billion, a record2. Goldman's equity-trading revenue jumped 72% to $7.42 billion. Investment-banking fees rose 24% in the first half. Citigroup produced its best revenue in a decade. These are not the numbers of a system starting to freeze up.
Under the S&P 500's headline loss, eight of eleven sectors were positive. Value and equal-weight outperformed cap-weighted. Energy jumped 4.7%1. Real estate and consumer staples added modest gains. This was not a market falling apart. This was a market rotating hard while pricing a live geopolitical premium.
The Real Catalyst
Two things happened this week that reset the interest-rate picture and then reset it back. On Monday, Governor Christopher Waller delivered a hawkish speech, and Kalshi-implied odds of a July hike briefly spiked to roughly 31%1213. By Wednesday, June CPI landed at negative 0.4% month-over-month, the biggest single-month deceleration since April 2020, and year-over-year at 3.5% versus 3.8% consensus14. Core CPI was flat month-over-month at 2.6% annual. On Tuesday, June PPI printed at negative 0.3% month-over-month and 5.5% year-over-year, well below the 6.2% consensus15. By Friday, Fisclear had the FOMC probability distribution back at hold 86%, hike 14%16.
The ten-year finished the week at 4.542%, down 2.6 basis points17. The Fed enters blackout at midnight tonight with a July 28-29 meeting ahead and a market that has priced its way to a pause consensus.
Then the weekend happened. A Friday attack in Jordan killed two US service members and left one missing, the first US kinetic deaths of the war418. CENTCOM responded with a seventh consecutive night of strikes across Iran19. Iran retaliated by hitting a desalination and power station in Kuwait, and Bahrain sounded air-raid sirens20. Tehran's Deputy Foreign Minister announced Iran was suspending its commitments under the June Islamabad memorandum, the framework meant to end the war. Supreme Leader Mojtaba Khamenei warned of "unforgettable lessons" to come21. NPR framed the arc as the two countries "lurching back toward all-out war"22.
Here is the catalyst that actually moved capital during the trading week. It was not the CPI print, and it was not Waller. It was the collision between two ideas that had been running in parallel for months and finally hit each other. Idea one: AI capex is durable and the hyperscalers are unstoppable. Idea two: cheap credit funds everything, and spreads at cycle tights validate the risk being taken. This week those ideas started to argue. And beneath both, the Middle East reasserted itself in a way that credit still refuses to price.
ASML raised full-year revenue guidance to €43-45 billion23. TSMC guided at the high end at $40.2 billion in Q2 revenue24. The fundamentals for the AI supply chain got stronger, not weaker. Yet the stocks were sold aggressively. Point Frederick noted hyperscaler credit spreads have widened to 153.5 basis points from 118 in February, and the cover ratio, free cash flow to debt service, has collapsed from roughly 5x to under 2x25. The market is not doubting AI demand. It is doubting how the demand is being financed.
Divergences Beneath the Surface
The most important number of the week is not the Nasdaq's loss. It is the six-basis-point tightening in high-yield OAS while semis were down five percent and Brent was up nearly ten dollars.
Historically, semiconductor drawdowns of that magnitude produce credit widening of ten to twenty basis points at minimum. Layer in a live oil shock and US casualties and the credit response should be sharper still. Instead, high-yield tightened. Either the credit market is late, as it often is at inflection points, particularly in high-yield where constituents skew to energy and benefit from a Brent rip. Or the equity move is not about stress at all, and the rotation into energy on a 4.7% weekly gain is what a healthy market does when the geopolitical premium re-emerges.
Oil is now the swing variable. Brent closed Friday around $88, up roughly 4.7% on the day and marking a weekly gain of nearly 5%265. WTI ran to $81.77, up 3.5% on the week27. Shipping through Hormuz has fallen to its lowest observed level, with Red Sea closure now a second tail risk on the table5. Gold, meanwhile, dropped 1.56% Friday to about $3,993, its lowest level since November 2025, as receding hike odds outweighed the safe-haven bid2829. Copper barely moved. The dollar drifted off 0.2% on the week30.
Read those cross-asset signals together. Oil up on real geopolitics and the first US kinetic casualties. Gold down on cooling inflation. The dollar softer. Consumer sentiment at 54.4, the highest since February31. Retail sales up 0.2% in June32. Jobless claims at 208 thousand33. This is a market receiving contradictory inputs and choosing to reprice one specific trade. Capital is leaving concentrated growth for cyclicals with an inflation hedge, energy, and for defensives with dependable cash flow. Financials sit in the middle: they printed the best earnings numbers in years and were rewarded for it.
Another divergence worth naming. The Trump administration's 25% Brazilian tariff effective July 2234 is the kind of policy shock that would normally push implied volatility higher. VIX did rise to about 19, still well inside normal ranges. If the market truly believed the tariff cascade was durable, or that the Iran cycle would break containment, VIX would look different, credit would look different, and the dollar would not have drifted weaker. The market is pricing tariffs and even a hot Iran exchange as noisy negotiation posture and localized conflict rather than structural cost shock. That may prove correct. It may prove complacent. The oil tape is the first place either verdict will show up.
One more divergence deserves attention. Financial-sector strength alongside tightening credit spreads has historically been late-cycle behavior. When banks report record trading and investment-banking revenue while spreads sit at multi-decade tights, the risk is not that current earnings are wrong. The risk is that the conditions producing them are unsustainable, that easy financing and cross-asset volatility are being priced as permanent features rather than a specific point in the cycle. The Point Frederick observation on hyperscaler cover ratios collapsing from 5x to under 2x is the kind of subsurface signal that eventually forces credit to widen. It is not widening yet.
The Week Ahead
Sunday's futures open is the first tell. If Brent gaps meaningfully higher and stays bid on Monday while high-yield holds tight, the rotation thesis firms up and the geopolitical premium becomes a durable feature, not a spike. If Brent gaps higher and high-yield finally widens, credit is admitting what equity and commodities have been telegraphing, and the divergence starts to compress in real time. If instead there is a weekend de-escalation, a cease-fire trial balloon, or a return to the memorandum, the oil premium will bleed out fast and last week's tech sell will look like nothing more than a positioning reset. Watch the FOMC meeting July 28-29 for shape rather than substance. The rate decision is already priced. The message about pace, dependency, and how the committee views a live geopolitical shock is not. And watch the second wave of Q2 earnings, which brings more mega-cap technology names into the spotlight, the same names whose stocks were repriced this week on nothing but sentiment.
So what:
The divergence between credit calm and equity rotation is the most valuable information the market gave up all week, and the weekend added a second lens to look at it through. When one asset class tells a story of stress, another tells a story of health, and a third tells a story of active war, the honest answer is usually that none of them is lying. They are looking at different parts of the cycle and different parts of the risk stack. Credit is telling us where the balance sheets are. Equity is telling us where the crowding was. Oil is telling us the geopolitical premium is real and not theoretical. All three truths can hold. What cannot hold is the belief that a market this dispersed, layered on top of a live kinetic conflict, will resolve without dispersion being repriced somewhere.
Signals lead. Markets lag. The gap between them is where the opportunity lives.
Sources
- Financial Synergies. https://www.finsyn.com/weekly-market-recap-july-17-2026/ ↩
- New York Times. https://www.nytimes.com/2026/07/14/business/jpmorgan-goldman-bofa-wells-fargo-bank-earnings.html ↩
- Shelton Capital. https://advisor.sheltoncap.com/2026/07/16/weekly-fixed-income-commentary-july-16-2026/ ↩
- AP. https://apnews.com/article/iran-us-hormuz-strait-war-july-18-2026-5adfef67554652580963684d9a663af2 ↩
- Reuters oil. https://www.reuters.com/business/energy/oil-rises-intensifying-us-iran-hostilities-threat-red-sea-closure-2026-07-17/ ↩
- Seattle Times. https://www.seattletimes.com/business/how-major-us-stock-indexes-fared-friday-7-17-2026/ ↩
- Capital Insight BD. https://www.capitalinsightbd.com/us-market-weekly-summary/ ↩
- Fortune. https://fortune.com/2026/07/17/netflix-stock-hit-52-week-low-after-earnings-analysts-say-investors-missing-big-picture-cfo/ ↩
- Reuters Netflix. https://www.reuters.com/business/media-telecom/lacks-excitement-netflix-tumbles-9-weak-earnings-forecast-deepens-doubts-over-2026-07-17/ ↩
- Raymond James. https://finvaulta.com/research/raymond-james/up-and-adam-2026-07-13 ↩
- Daily Stocks 7. https://dailystocks7.com/2026/07/15/wall-street-61-billion-revival-q2-2026-bank-earnings/ ↩
- Octagon AI. https://www.octagonai.co/news/federal-reserve-july-2026-rate-hike-odds/ ↩
- WSJ Waller. https://www.wsj.com/livecoverage/stock-market-today-dow-sp-500-nasdaq-07-13-2026/card/waller-signals-readiness-to-raise-rates-soon-if-inflation-doesn-t-improve-T9ADxxWtinw43iANocAb ↩
- BLS CPI. https://www.bls.gov/cpi/ ↩
- BLS PPI. https://www.bls.gov/news.release/archives/ppi_07152026.htm ↩
- Fisclear. https://www.fisclear.com/fed-watch ↩
- Morningstar. https://www.morningstar.com/news/dow-jones/202607176626/10-year-treasury-yield-falls-to-4542-this-week-data-talk ↩
- Washington Post. https://www.washingtonpost.com/world/2026/07/18/iran-us-hormuz-strait-war-july-18-2026/4c9781c2-827b-11f1-8a16-393bd03340b0_story.html ↩
- Al Jazeera. https://www.aljazeera.com/news/2026/7/18/iran-accuses-us-of-striking-critical-infrastructure-as-war-intensifies ↩
- Reuters Iran. https://www.reuters.com/world/middle-east/iran-renews-attacks-gulf-states-after-another-night-us-strikes-2026-07-18/ ↩
- The Hindu. https://www.thehindu.com/news/international/west-asia-war-us-strikes-iran-tehran-hits-usa-military-sites-in-kuwait-jordan-live-updates-july-18-2026/article71236973.ece ↩
- NPR. https://www.npr.org/2026/07/18/nx-s1-5898916/us-iran-escalate-strikes ↩
- CNBC. https://www.cnbc.com/2026/07/15/asml-2q-earnings-ai-chips-orders.html ↩
- Yahoo Finance TSMC. https://finance.yahoo.com/markets/stocks/articles/taiwan-semiconductor-manufacturing-co-ltd-130034778.html ↩
- Point Frederick. https://pointfrederick.substack.com/p/point-frederick-spinnaker-july-17 ↩
- UNI India. http://www.uniindia.com/brent-crude-climbs-to-88-per-barrel-as-shipping-in-strait-of-hormuz-falls-to-it-lowest/world/news/3914023.html ↩
- Convex. https://convextrade.com/metrics/wti ↩
- Yahoo Finance Gold. https://finance.yahoo.com/personal-finance/investing/article/gold-prices-today-friday-july-17-2026-gold-nosedives-to-nov-25-levels-as-iran-airstrikes-intensify-121125037.html ↩
- USA Today. https://www.usatoday.com/story/money/personalfinance/2026/07/17/gold-price-on-july-17-2026/90953532007/ ↩
- Reuters dollar. https://www.reuters.com/world/asia-pacific/dollar-set-weekly-drop-traders-cut-wagers-rate-hikes-2026-07-17/ ↩
- University of Michigan. https://www.sca.isr.umich.edu/ ↩
- CNN. https://www.cnn.com/2026/07/16/economy/us-retail-sales-june ↩
- Zacks. https://www.zacks.com/stock/news/2954993/retail-sales-come-in-better-than-expected ↩
- Peterson Institute. https://www.piie.com/blogs/realtime-economics/2026/trumps-new-tariffs-brazil-reflect-weakness-us-trade-strategy ↩